Probability
Chapters
Conditional Probability
Conditional Probability
Conditional Probability deals with dependent events
Independent Events
An event is independent if it is not affected by any event that goes before it.
Example
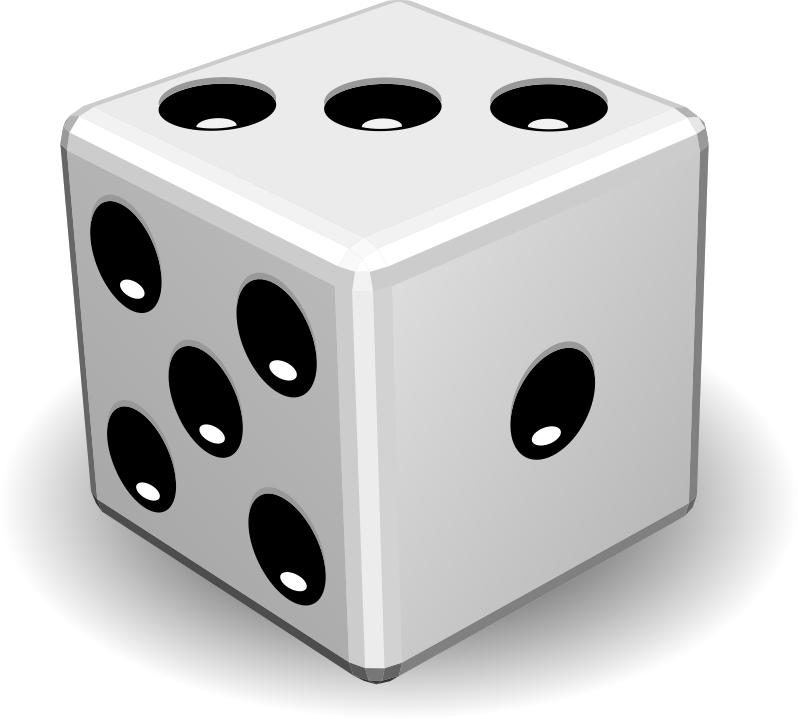
Rolling a die is an independent event.
Each roll of the die has size possible outcomes, and the result of a preceding roll does not affect the result of a current roll.
The chance of rolling a \(3\) is simply \(\dfrac{1}{6}\), regardless of how many times you have rolled the die before hand.
Each roll of the die is an independent event.
Dependent Events
Dependent Events are actually affected by what's happened before hand.
Let's start by thinking about drawing jelly babies out of a bag.
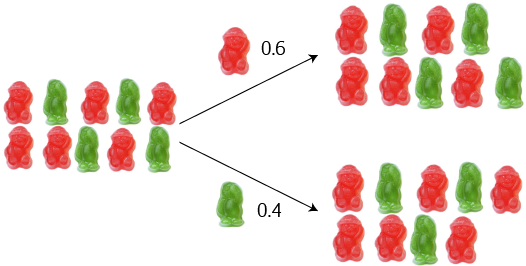
A bag contains 6 red jelly babies and 4 green jelly babies. The probability of drawing a red jelly baby out of the bag (without looking) is \(\dfrac{6}{10} = 0.6\), and the probability of drawing a green jelly baby out of the bag (without looking) is \(\dfrac{4}{10} = 0.4\).
On the right is a tree diagram for drawing a jelly baby out of this bag.
But, what happens next time you decide to draw a jelly baby out of the bag? If you eat the first jelly baby (so you can't put it back), things change. There are now only 9 jelly babies left in the bag.
Next time,
- If you got a red jelly baby on the first draw, the chance of getting another red jelly baby on the second draw is \(\dfrac{5}{9}\).
- If you got a red jelly baby on the first draw, the chance of getting a green jelly baby on the second draw is \(\dfrac{4}{9}\).
- If you got a green jelly baby on the first draw, the chance of getting a red jelly baby on the second draw is \(\dfrac{6}{9} = \dfrac{2}{3}\).
- If you got a green jelly baby on the first draw, the chance of getting another green jelly baby on the second draw is \(\dfrac{3}{9} = \dfrac{1}{3}\).
Replacement
If we put the jelly baby back in the bag each time (that's too cruel!), then the chances do not change, and the events are independent.
Problems will often use words like with replacement to indicate that events are independent and without replacement to indicate that the events are dependent
It pays to read the problems carefully. Remember: with replacement, the chances do not change; without replacement, the chances change.
Tree Diagrams
Tree diagrams provide a great way of visualising what is going on, and keeping track of chances that either change (or don't change). Let's build a tree diagram for our jelly babies. No, Sam: that doesn't make them jelly monkeys!
Now we aren't putting the jelly babies back: the events are dependent.
On the first draw, there's a \(\dfrac{6}{10} = 0.6\) chance of getting a red jelly baby, and a \(\dfrac{4}{10} = 0.4\) chance of getting a green jelly baby. The tree diagram looks like this:

Let's draw another jelly baby, without replacing the first. It's OK, you can eat the first one. We calculated the probabilities earlier, so our tree diagram looks like this:
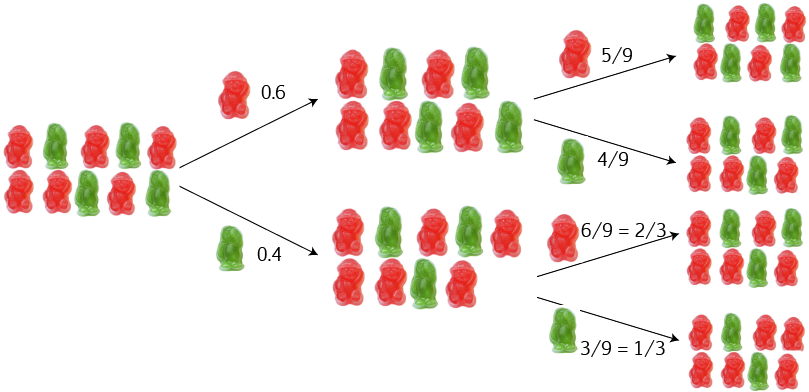
- If you got a red jelly baby on the first draw, the chance of getting another red jelly baby on the second draw is \(\dfrac{5}{9}\).
- If you got a red jelly baby on the first draw, the chance of getting a green jelly baby on the second draw is \(\dfrac{4}{9}\).
- If you got a green jelly baby on the first draw, the chance of getting a red jelly baby on the second draw is \(\dfrac{6}{9} = \dfrac{2}{3}\).
- If you got a green jelly baby on the first draw, the chance of getting another green jelly baby on the second draw is \(\dfrac{3}{9} = \dfrac{1}{3}\).
I want to know the probability of drawing two green jelly babies on my two goes. There is a \(\dfrac{4}{10}\) chance, followed by a \(\dfrac{1}{3}\) chance. We multiply these two probabilities to give:

Notation for Conditional Probability
Mathematicians love their notation. They don't use notation to annoy you, they use it to make it easier to express things, and more precise.
Here is the notation we use for conditional probability:
- We use \(P(A)\) to refer to the probability that Event A occurs.
- If you got a red jelly baby on the first draw, the chance of getting a green jelly baby on the second draw is \(\dfrac{4}{9}\).
- If you got a green jelly baby on the first draw, the chance of getting another green jelly baby on the second draw is \(\dfrac{3}{9} = \dfrac{1}{3}\).
For our jelly baby example,

In general, we write
Example
100 tickets have been sold for a raffle. You have purchased 5 of them, and you are hoping to win the 2nd prize (the 1st prize is lame). What is the probability of failing to win 1st prize and winning second prize?
Event A is not winning 1st prize, and Event B is winning 2nd prize.
For Event A, there are 95 tickets in the raffle that are not your tickets. So the probability of losing first prize is:
After removing the first prize winning ticket from the barrel, 99 tickets remain. 5 of them are yours. The probability of winning second prize is then
So,
So the chance of winning second prize, but not first, is 19 in 396, or about \(4.8\%\).
A Formula for the Probability of B given A
We can rearrange the formula for the probability of A and B to give a formula for P(B|A) as follows:
Example
\(80\%\) of your friends like dogs and \(40\%\) like both dogs and cats. What percentage of those who like dogs also like cats?
We need to find
Example: Gus and Alyce
Our neighbourhood speed demons, Gus the snail and his friend, Alyce, are having a race. Their friend, Christo is acting as the referee. The outcome of the race depends on the course chosen, and that is up to Christo.
There are two tracks that Christo can choose for the race. His favourite track is the leafy track, which he chooses with probability 0.8.
Gus has different probabilities of winning the race, depending on the track chosen:
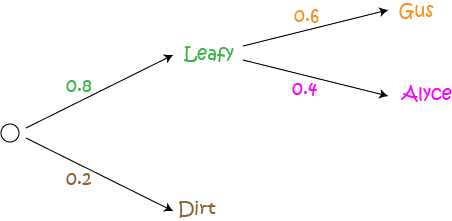
- His probability of winning on the leafy track is 0.6
- His probability of winning on the dirt track is 0.3
What is the probability of Gus winning the race?
This example includes dependent events because the probability of Gus winning depends on which track Christo chooses. Let's build a tree diagram for this example. We begin with the two tracks that Christo might choose:
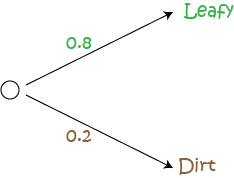
Because there are only two tracks to choose from, and Christo chooses the leafy track with probability 0.8, the probability of him choosing the dirt track is \(1 - 0.8 = 0.2\). Probabilities always add up to 1.
Now, if the leafy track is chosen, Gus has probability 0.6 of winning. So, the probability of Alyce winning on the leafy track is \(1 - 0.6 = 0.4\). Let's fill those probabilities in on the diagram:
What if the dirt track is chosen? Gus has probability 0.3 of winning there, so Alyce wins with probability \(1 - 0.3 = 0.7\). Let's fill in the rest of the diagram:
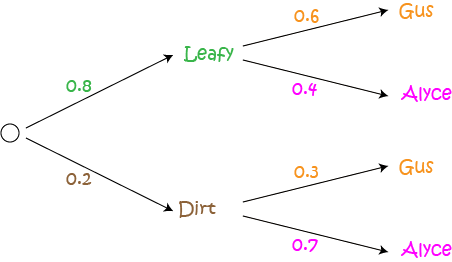
Now we can use our diagram to calculate the probabilities of Gus winning on each track. Follow the branches through to each outcome corresponding to a winning for Gus, and multiply the probabilities that appear on the branches on your path. Remember that
The probability of the leafy track being chosen and Gus winning is given by

The probability of the dirt track being chosen and Gus winning is given by

Now, we add the values that we have calculated in our column:
Checking Our Work
We can check our work by calculating the other probabilities (i.e. of Alyce winning) and making sure that all the probabilities sum to 1:

We have time for one last example.
Example: Missing Pieces
A warehouse holds 100 copies of a jigsaw puzzle. 5 of them are missing pieces. If we choose two copies of the puzzle at random, what is the probability that each one of them has all of its pieces?
Solution:
Let A be the event that the first puzzle chosen is not defective, and let B be the event that the second puzzle chosen is not defective. Then
Note: We can extend this idea to three, or even more puzzles. We simply need to multiply our probabilities by more terms. Let's see what we do with three puzzles. Remember, we want none of them to be missing pieces, so we first need to find the probability that the third one has no missing pieces, given that the first two also have no missing pieces. Let C be the event that the third puzzle has no missing pieces.
Given that the first and second puzzles have no missing pieces, we need to choose our third puzzle from 93 good puzzles and 5 puzzles with missing pieces. So,
Conclusion
Tree diagrams are useful for keeping track of dependent probability calculations.
Some useful formulas for conditional probability are
Description
In this mini series, you will learn a bit more on the topic of probability, we will cover topics such as
- Ratios
- Fair dice
- Conditional probability
- Mutually exclusive events
and more
Audience
Year 10 or higher students
Learning Objectives
Explore more on the topic of probability
Author: Subject Coach
Added on: 28th Sep 2018
You must be logged in as Student to ask a Question.
None just yet!