Year 10+ Coordinate Geometry
Chapters
Finding the Graph for an Equation
Finding the Graph for an Equation
The graph for an equation is the set of points at which the equation is satisfied (that is, the \(x\) and \(y\)-values that work!).
Let's look at a few examples.
Example 1
To find the graph of the equation \(y= 2x + 1\), we start by plotting some points at which the equation is satisfied:
| \(x\) | \(y = 2x + 1\) |
|---|---|
| \(-2\) | \(-3\) |
| \(-1\) | \(-1\) |
| \(0\) | \(1\) |
| \(1\) | \(3\) |
| \(2\) | \(5\) |
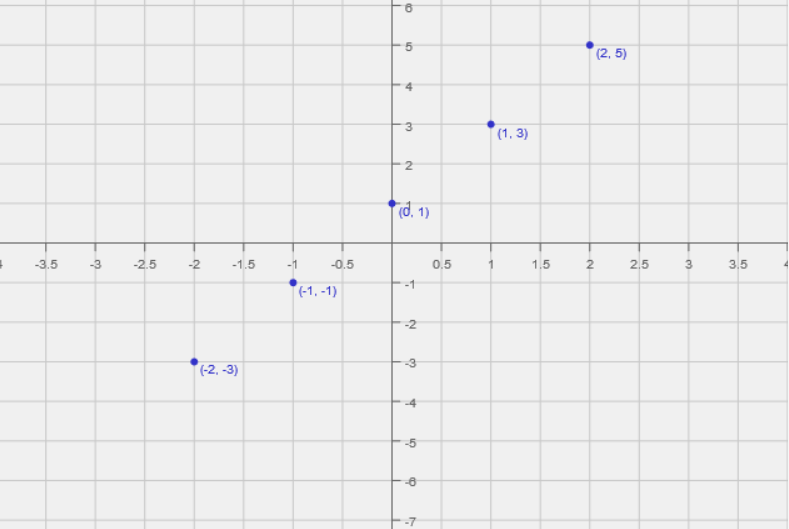
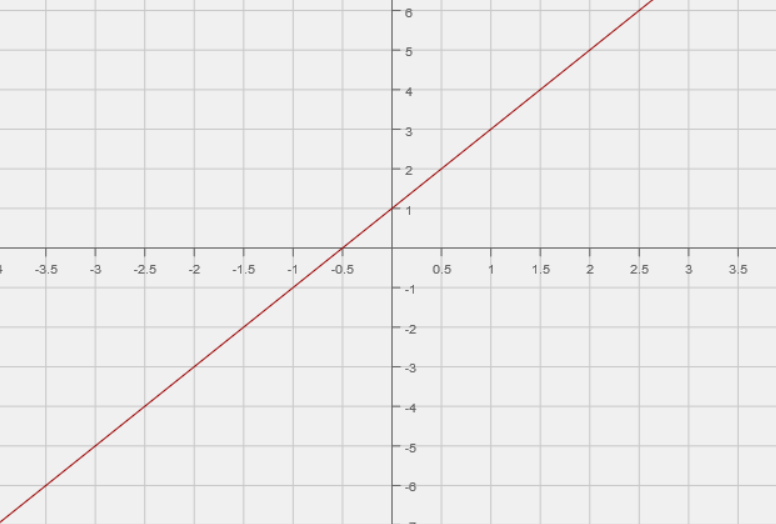
In this example, joining all these points will give the graph of the function, which is the set of all points satisfying the equation. Of course, we can only show a finite section of the graph. This graph will go on forever in both directions. Here's part of the graph of the equation \(y = 2x + 1\):
Example 2
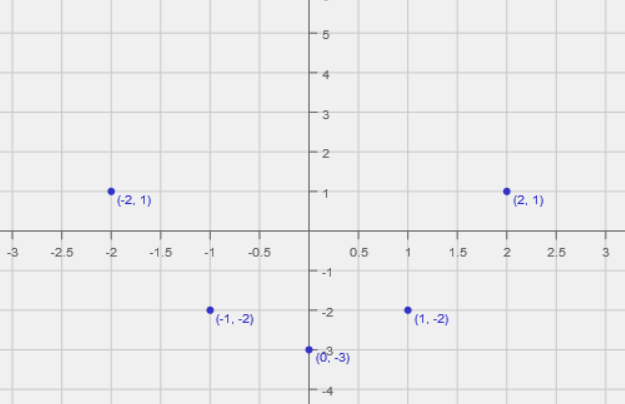
To find the graph of the equation \(y= x^2 - 3\), we also start by plotting some points at which the equation is satisfied:
| \(x\) | \(y = x^2 - 3\) |
|---|---|
| \(-2\) | \(1\) |
| \(-1\) | \(-2\) |
| \(0\) | \(-3\) |
| \(1\) | \(-2\) |
| \(2\) | \(1\) |
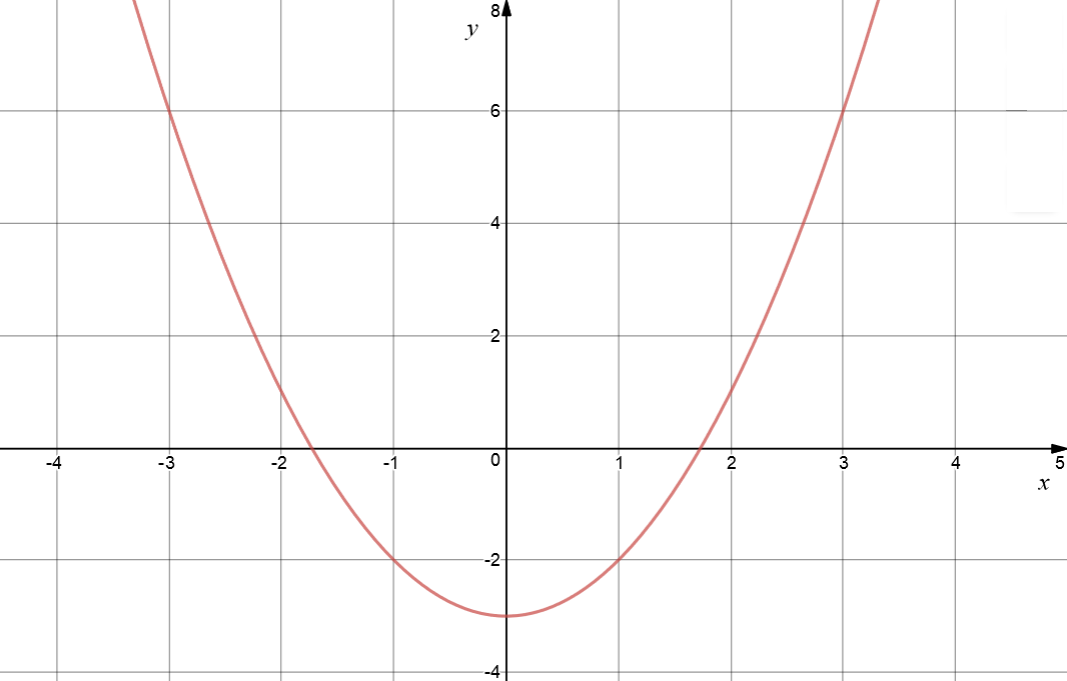
In this example, these points and our knowledge of the graph of equations like this give us a good idea of the graph of the function, which is the set of all points satisfying the equation. Of course, we can only show a finite section of the graph. It is best to plot as many points as possible. This graph will extend forever upwards. Here's part of the graph of the equation \(y = x^2 - 3\):
Now let's look at an example in which plotting just a few points can be misleading.
Example 3
To find the graph of the equation \(y= x^3 - 2x + 2\), we also start by plotting some points at which the equation is satisfied. If we start with just these points
| \(x\) | \(y = x^3 - 2x + 2\) |
|---|---|
| \(-2\) | \(-2\) |
| \(0\) | \(2\) |
| \(2\) | \(6\) |
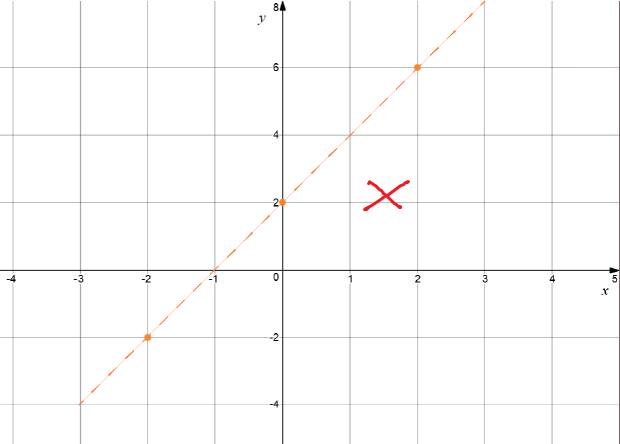
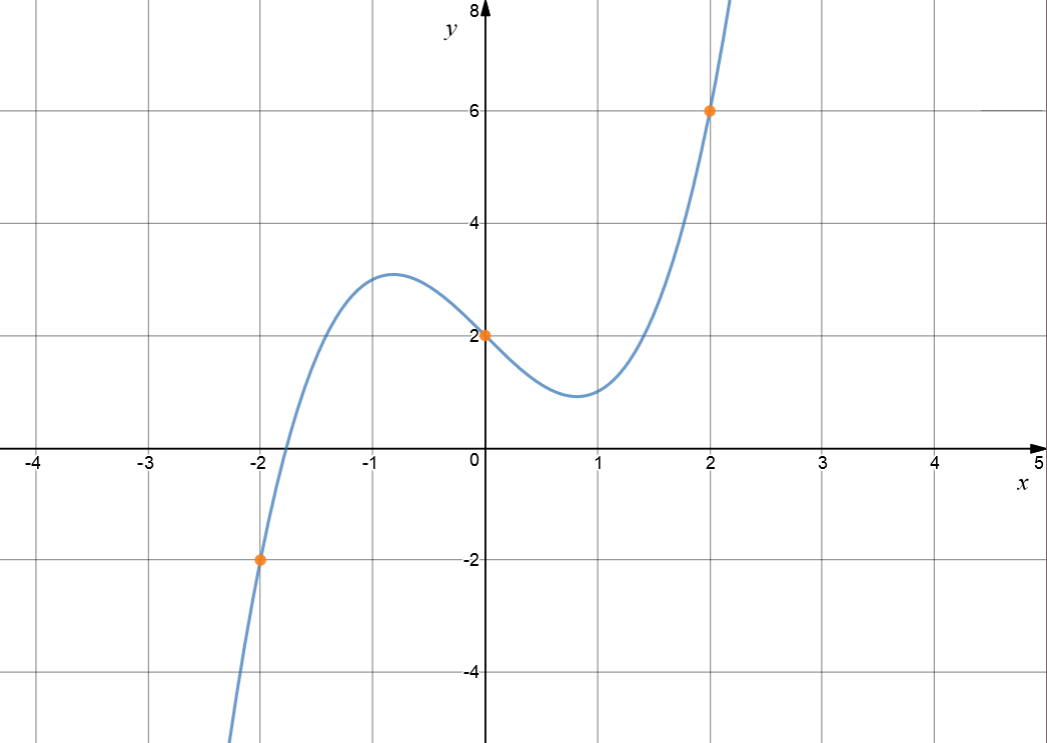
If we'd plotted a few more points satisfying the equation before we tried to draw the graph, we'd have realised that the graph actually looks more like this:
More Suggestions for Graphing Equations
If you get really stuck, you can use one of the many free on-line graphing calculators that are available. I like Desmos and GeoGebra, but there are quite a few of them. It's good to play around with them to get an idea of what the graphs of various types of equations look like.
It's also a good idea to learn to recognise the equations of some common types of graphs like straight lines, parabolas and circles.
A really good graph of an equation should include the following features:
- \(x\) and \(y\)-intercepts.
- Maximum values (peaks)
- Minimum values (valleys)
- Any areas where the graph plateaus (is flat)
- Asymptotes (lines that the graph gets as close as you like to, but never crosses)
- Any gaps or jumps
- A few plotted points
- Where is the graph increasing (going uphill) or decreasing (going downhill)?
- What happens to the graph for very large and very small values of \(x\)?
- Any other special features of the equation
In Years 11 and 12, you'll learn about Calculus. Calculus provides you with a wonderful tool kit for finding the important features of equations, and so will help you to draw their graphs.
Description
A coordinate geometry is a branch of geometry where the position of the points on the plane is defined with the help of an ordered pair of numbers also known as coordinates. In this tutorial series, you will learn about vast range of topics such as Cartesian Coordinates, Midpoint of a Line Segment etc
Audience
year 10 or higher, several chapters suitable for Year 8+ students.
Learning Objectives
Explore topics related to Coordinates Geometry
Author: Subject Coach
Added on: 27th Sep 2018
You must be logged in as Student to ask a Question.
None just yet!