Year 10+ Coordinate Geometry
Chapters
Graphing a Quadratic Equation
Graphing a Quadratic Equation
Quadratic Equations look like this:
We are interested in solving quadratic equations. To do this, it helps to graph the function
The Function \(y = ax^2\)
The simplest quadratic function is \(y = ax^2\). Its graph is a parabola, with its vertex at \((0,0)\). Let's see how the graph changes for different values of \(a\).
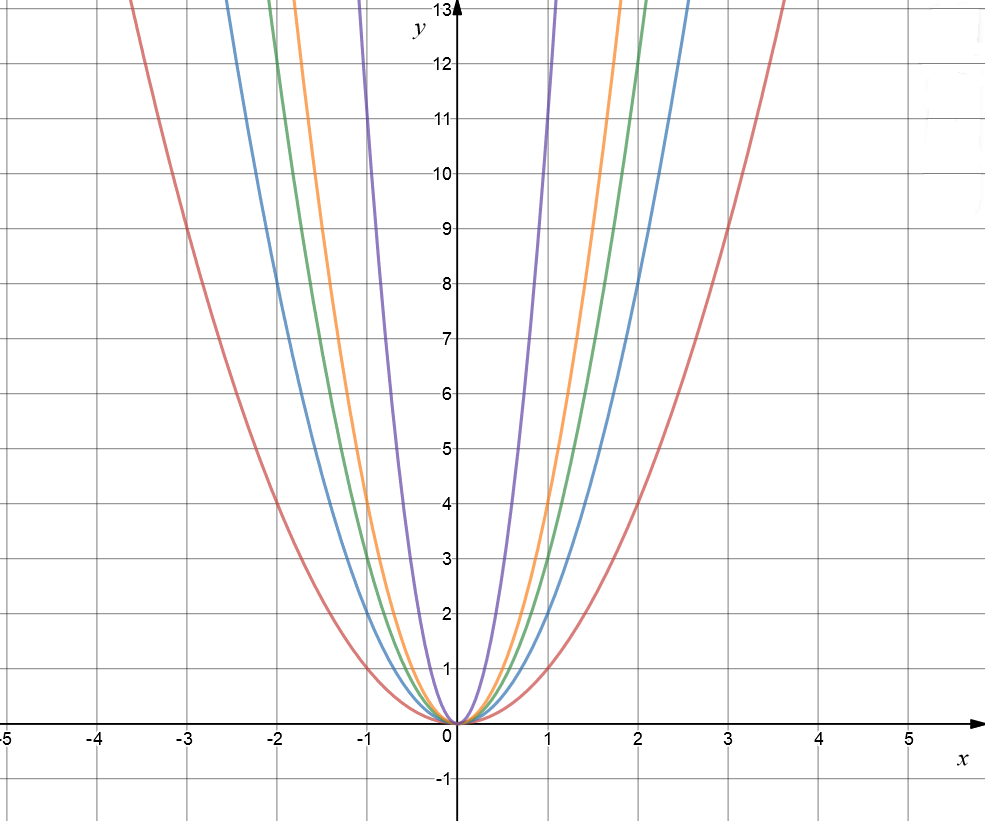
Let's see what happens to graph if we set \(b = c = 0\), and \(a\) to different positive values. In the picture, the red graph shows \(y = x^2\), the blue graph is \(y = 2x^2\), the green graph is \(y = 3x^2\), and the orange graph is \(y = 4x^2\). I went all out for the purple graph: it is \(y = 11x^2\). Do you notice how, as we increase the value of \(a\), the graph gets steeper and narrower? The graph gets wider and slopes more gradually as we decrease the value of \(a\).
Everything's Topsy-Turvy with Negative Values of \(a\)
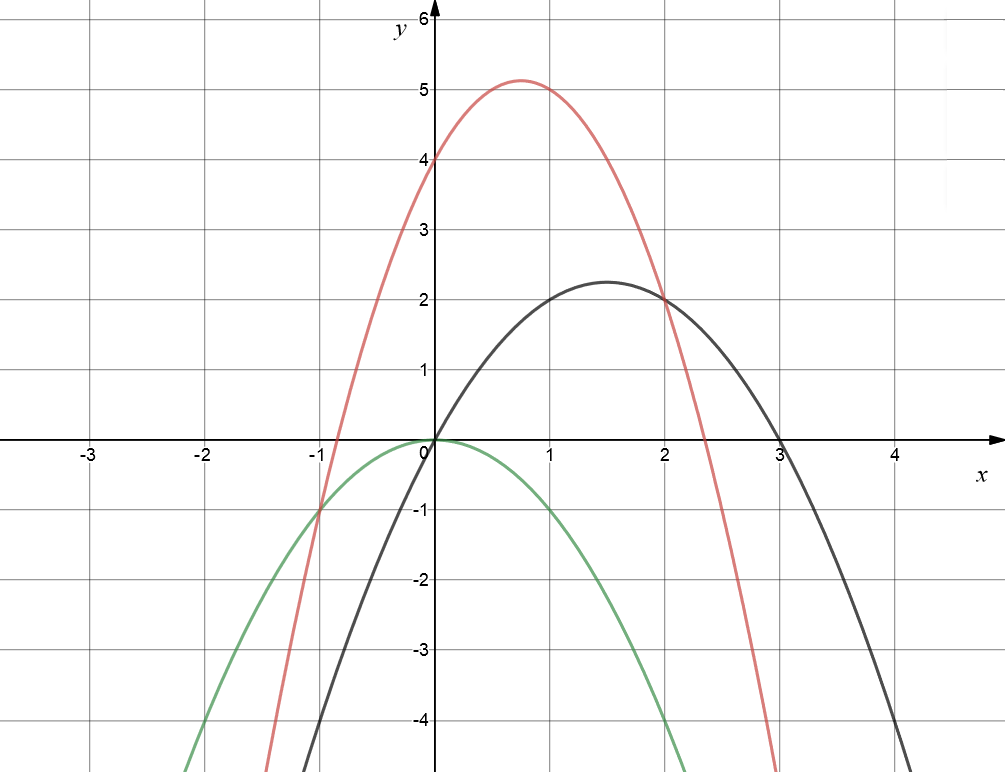
If we make \(a\) negative, we turn the graph upside down.
The red graph is \(y = -2x^2 + 3x + 4\), the black graph is \(y = -x^2 + 3x\), and the green graph is \(y = -x^2\). They are all upside down parabolas.
General Quadratic Equations
The standard form of the general quadratic function is \(f(x) = ax^2 + bx + c\). When we need to graph a quadratic function, there's another form that can help us out. It's called the vertex form of the quadratic function. The vertex is the minimum point (if the parabola is right way up) or the maximum point (if the parabola is upside down) of the parabola. The vertex form of the quadratic function looks like this:
- \(h = - \dfrac{b}{2a}\) and
- \(k = f(h)\)
- Calculate \(h = -\dfrac{b}{2a}\) and then
- Plug our new value of \(h\), which is the \(x\)-coordinate of the vertex, into the equation for \(f(x)\) to find the \(y\)-coordinate of the vertex.
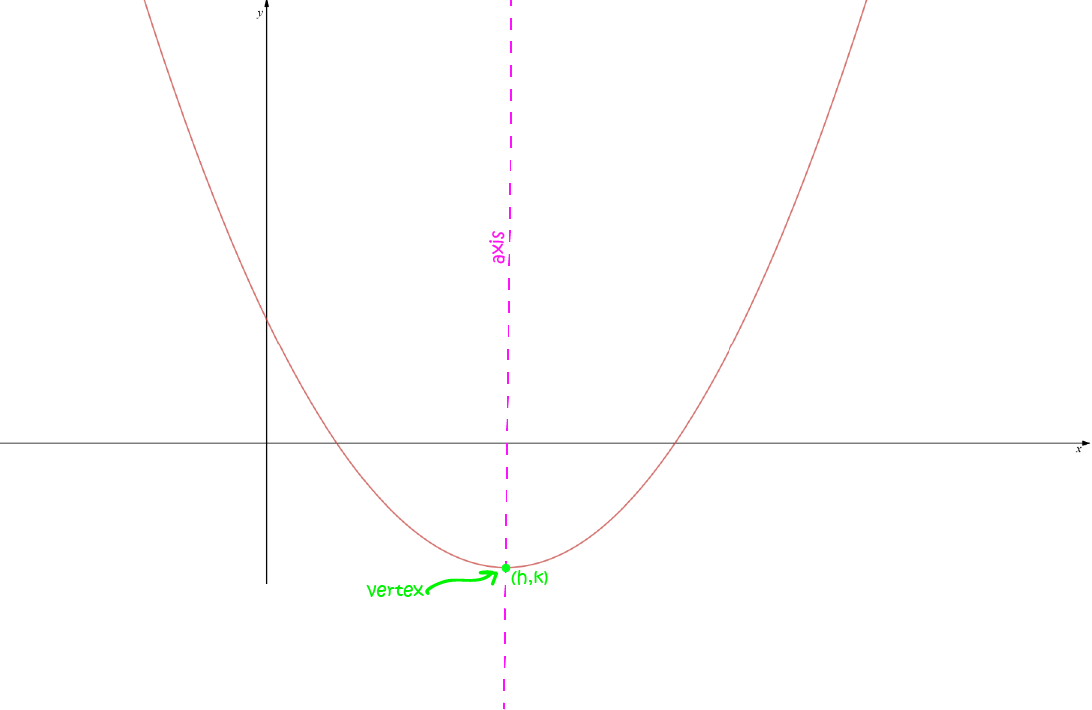
When the equation is in vertex form, we can not only read off the coordinates of the vertex, but we also know the equation of the axis of symmetry of the parabola. It's the line \(x = h\). The graph is symmetric about this line.
- The value of \(h\) tells us how far to the left or right the graph of \(y = ax^2\) has been shifted, and
- the value of \(k\) tells us how far up or down the graph of \(y = ax^2\) has been shifted
Let's see how this appears on the graph:
Let's work through an example.
Example
Find the graph of \(f(x) = 3x^2 - 18x + 15\).
Solution: In this equation
- \(a = 3\)
- \(b = -18\)
- \(c = 15\)
Because \(a > 0\), the parabola faces upwards (it is U-shaped).
Because \(a = 3\), the parabola is thinner than the graph of \(y = x^2\).
Next, find \(h\) and \(k\):
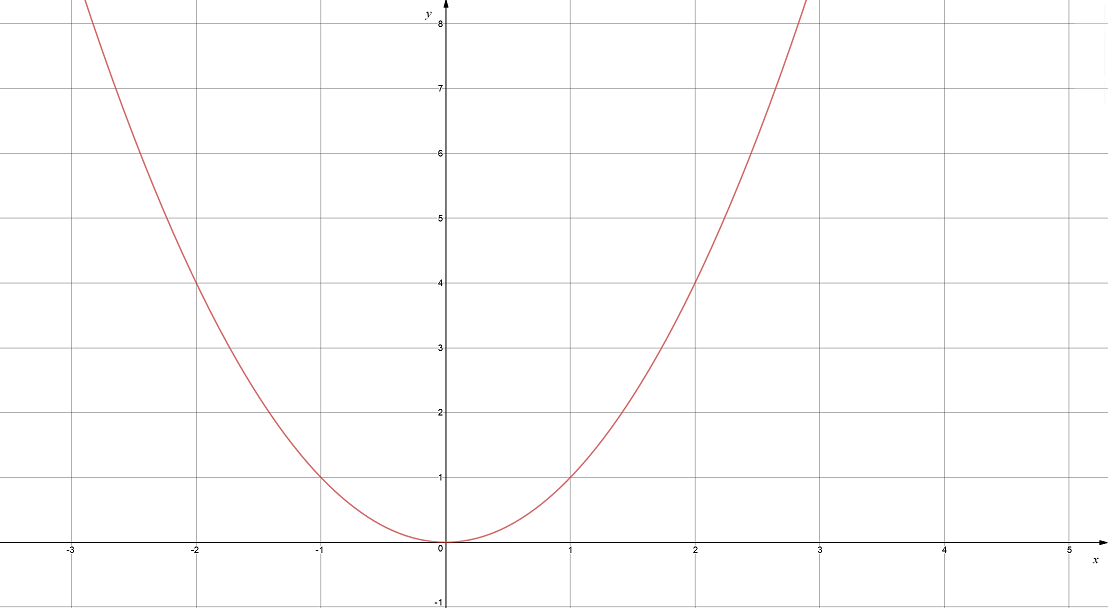
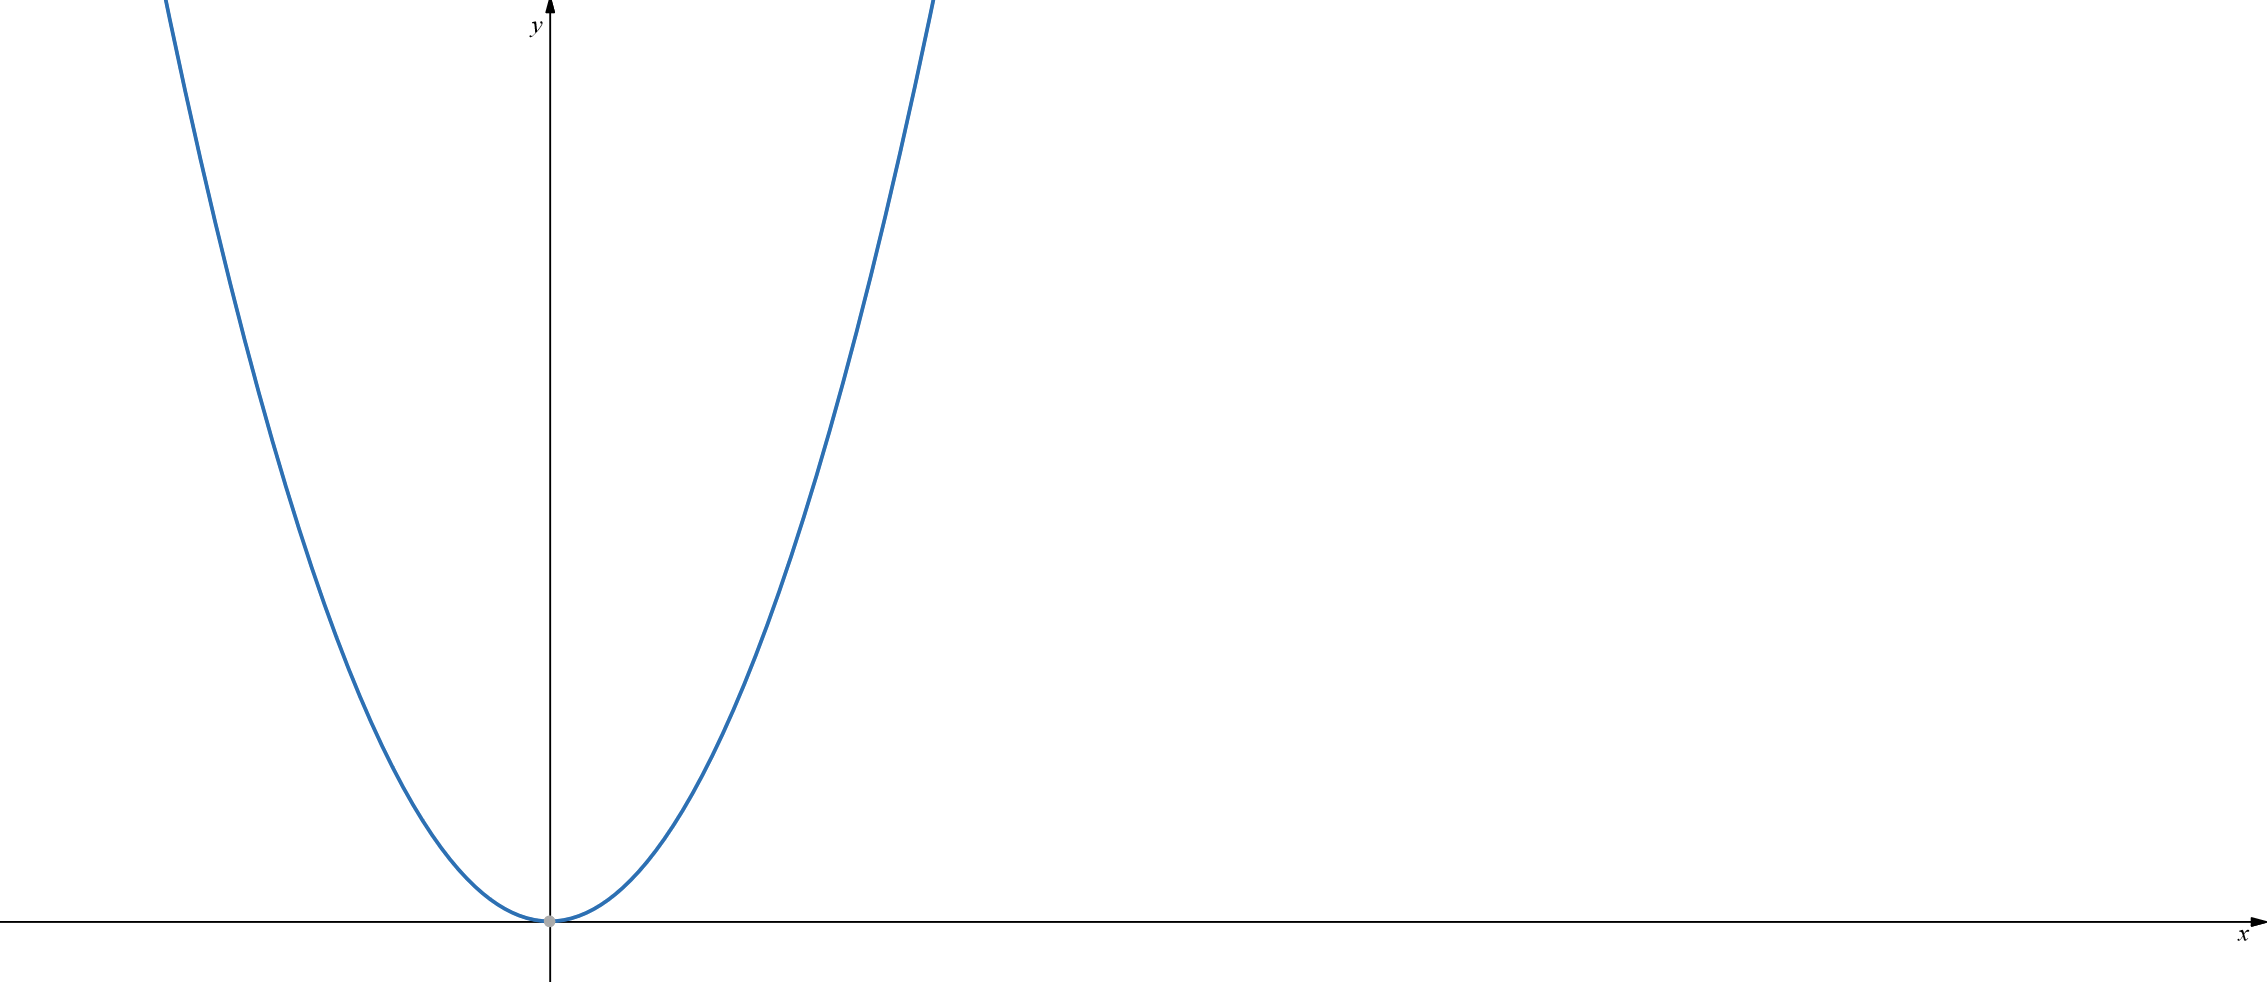
Step 1: Start with \(y = x^2\):
Step2: Make it skinny to form \(y = 3x^2\):
Step3: Move the graph across and down so that the vertex lands at \((3,-12)\):
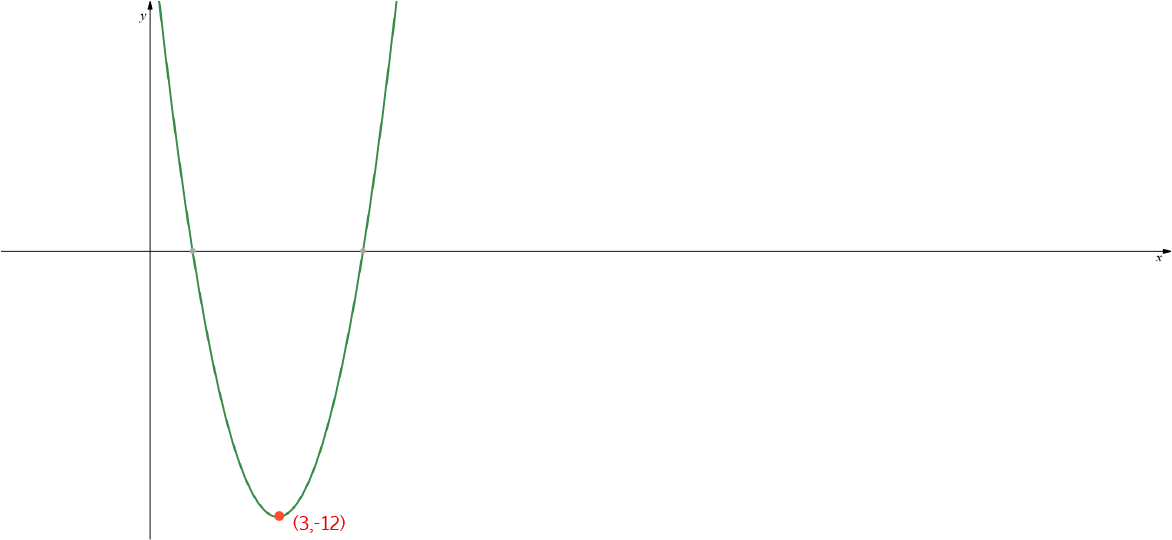
The vertex is at \((3,-12)\), and the axis is the line \(x = 3\).
Can You Find the Equation if You Know What the Graph Looks Like?
Let's look at an example.
Example:
Suppose you have plotted some points from a data set, and it looks like this:
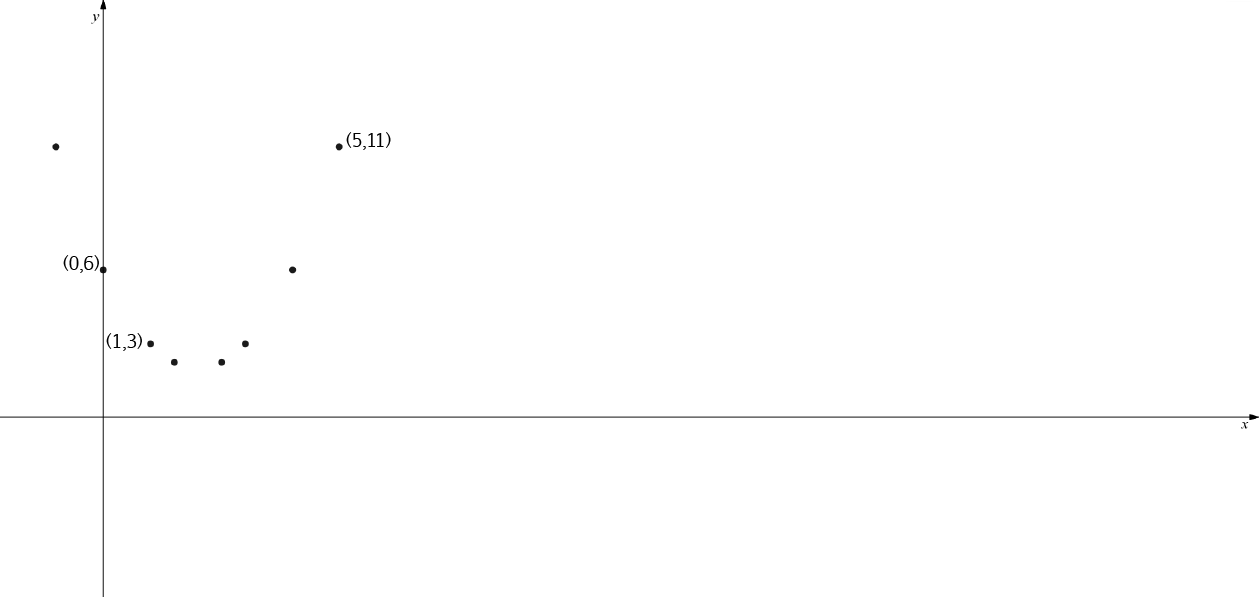
To find the equation of a parabola, we only need to know three points. In this example, we know the points \((0,6)\), \((1,3)\) and \((5,11)\). We can plug these into the standard form of the equation of a parabola to find the values of \(a\), \(b\) and \(c\), and hence the equation of the parabola.
- Using the point \((0,6)\), we obtain \(6 = a(0)^2 + b(0) + c\), so \(c = 6\).
- Using the point \((1,3)\), we obtain \(3 = a(1)^2 + b(1) + 6\), so \(a + b = -3\).
- Finally using the point \((5,11)\), we obtain \(11 = a(5)^2 + b(5) + 6\), so \(25 a + 5b = 5\), and dividing by \(5\), \(5a + b = 1\).
- We can solve the last two equations simultaneously to find the values of \(a\) and \(b\), which are \(a = 1\), and \(b = -4\).
If you can't remember how to solve equations simultaneously, it would be a good idea to read the articles on solving simultaneous equations.
Finally, the equation of our quadratic function is
Why not have a play around with some more quadratic equations, yourself, and then check your results using an on-line graphing calculator? Have fun!
Description
A coordinate geometry is a branch of geometry where the position of the points on the plane is defined with the help of an ordered pair of numbers also known as coordinates. In this tutorial series, you will learn about vast range of topics such as Cartesian Coordinates, Midpoint of a Line Segment etc
Audience
year 10 or higher, several chapters suitable for Year 8+ students.
Learning Objectives
Explore topics related to Coordinates Geometry
Author: Subject Coach
Added on: 27th Sep 2018
You must be logged in as Student to ask a Question.
None just yet!