Data
Chapters
What is Data?
What is Data?
Data is information about something or some things. It can include measurements, numbers, words, descriptions, opinions, or observations.
For example, the numbers of jelly beans in each packet in a box of packets of jelly beans form a set of data.
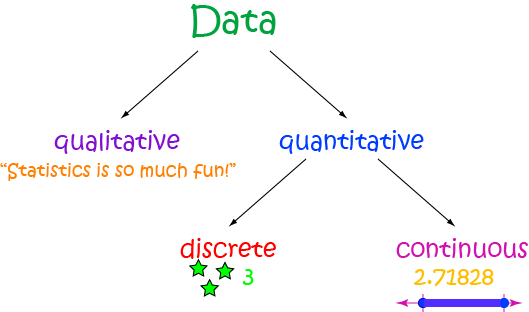
Data can be grouped into two types: qualitative data and quantitative data.
Qualitative and Quantitative Data
Quantitative Data is numerical data. It consists of lists of numbers. Quantitative data might include things like lists of heights or weights, numbers of bananas in bunches or the times you have spent procrastinating
before starting your homework each day.
Qualitative Data includes lists of descriptions or opinions about things.
These two words are very similar, but there's an easy way to remember which is which:
-
Discrete Datais data that can only have certain values. If we plot it on a number line, there are lots of gaps. Discrete data is the sort of data you use to count things, like the number of jelly beans in a packet. -
Continuous Datais data that can take any value in a range of values. If we plot it on a number line, it is possible that we'll need to colour in the whole range of values between some minimum and maximum values. There don't have to be any gaps. An example of continuous data is the set of weights of the jelly beans in a packet. Continuous data is usually obtained by taking measurements. - They are green.
- They taste bad. Sorry, did I let that slip? I'll correct myself. They taste delicious.
- Your mum thinks they're good for you.
- My husband thinks brussels sprouts are delicious (and no, I'm not lying).
- They are hot.
- They take too long to decompose on the compost heap.
- My dog Lucy won't eat them.
-
Discrete:
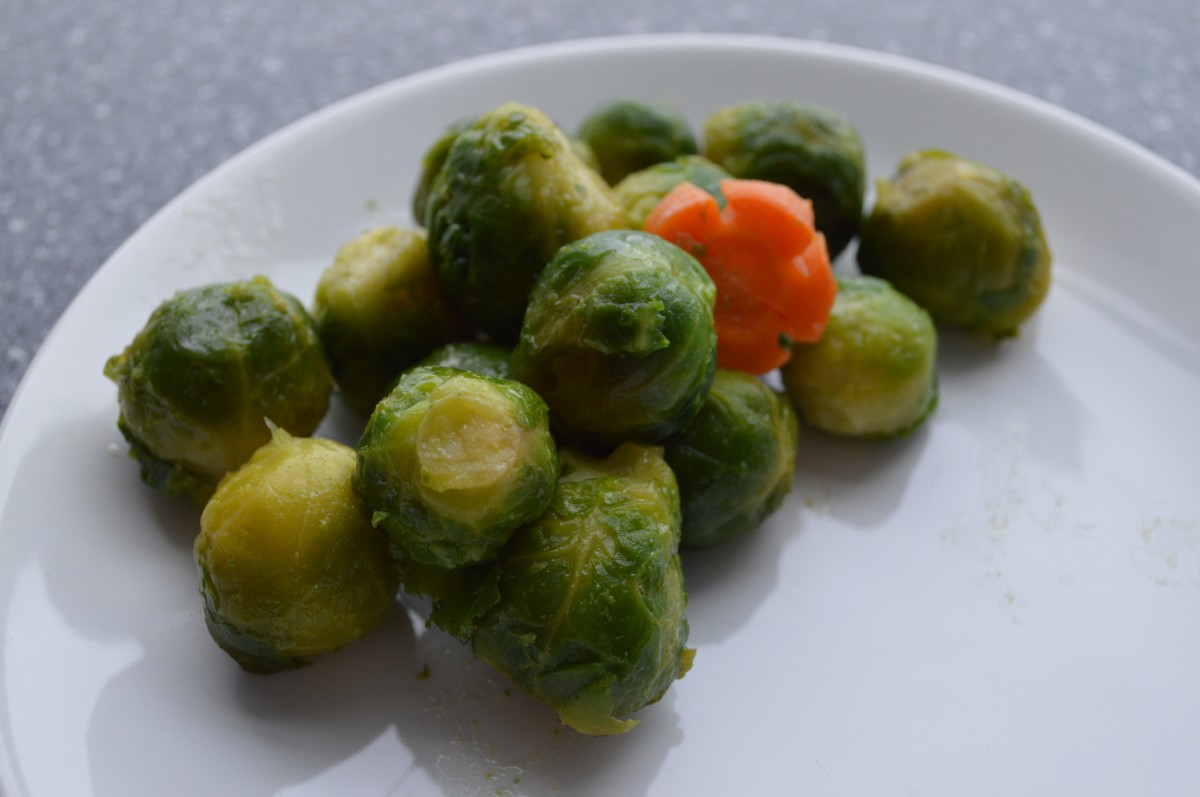
- There are \(14\) of them.
- Each has \(35\) leaves.
-
Continuous:
- Their weights are 9.5 g, 9.7 g, 10.2 g, 9.3 g, 9.8 g, 9.92 g, 10.11 g, 9.45 g, 9.4356 g, 10.1213 g, 9.28 g, 9.764 g, 9.923 g and 9.97532 g.
- Their diameters are 2.234 cm, 2.456 cm, 2.874 cm, 2.9865 cm, 2.378 cm, 2.12345 cm, 2.8567 cm, 2.123 cm, 2.958 cm, 3.1211 cm, 2.9933212 cm, 2.91 cm, 2.243 cm and 2.32521 cm.
- The number of people in the members stand at the SCG on each day of the summer (discrete).
- The number of no balls bowled by each of the Australian bowlers during a test match (discrete).
- The heights of the students in your class (continuous).
- The weights of the ducklings on the Myall Lakes (continuous).
- The times it takes people to swim \(100 \text{ metres}\) (continuous).
- The colours of the ducklings down at the pond.
- The ways people describe the ducklings down at the pond.
- The ways people describe the taste of broccoli.
- The ways people describe the scent of flowers.
- The colours of the flowers in your garden.
- Your friends' favourite movies.
Quantitative data talks about quantities
Qualitiative data talks about qualities

We can divide quantitative data up into two types:
Example

Here's a delicious looking plate of brussels sprouts. I'm sure this is exactly what you are hoping you'll be served up for dinner tonight. What sort of data can we collect about this plate of brussels sprouts?
Qualitative Data:
Quantitative Data
Some more examples
Quantitative Data
Qualitative Data
Collecting Data

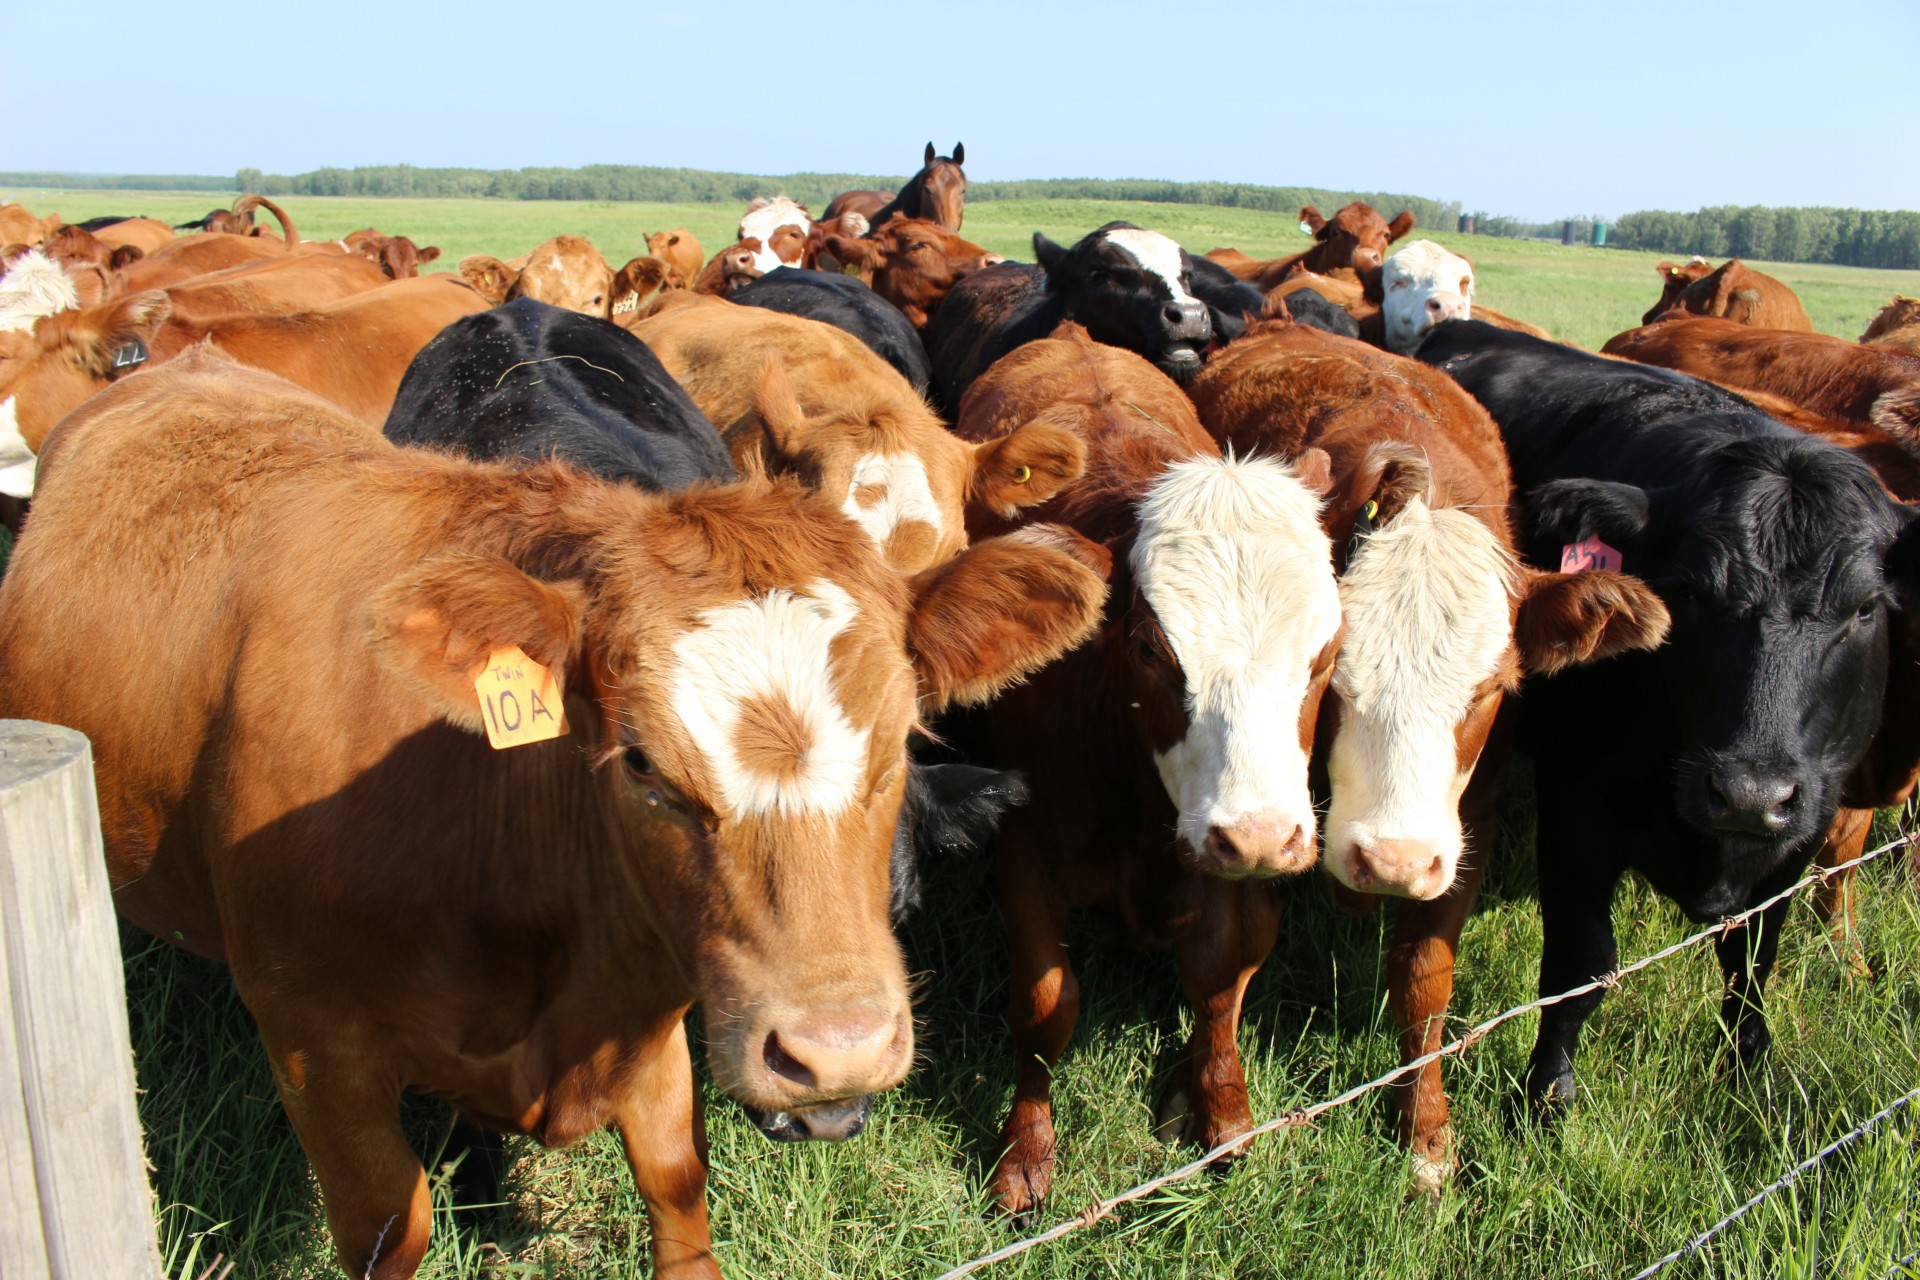
The easiest way to collect data is by direct observation. For example, if you wanted to study the numbers of cows kept by the farmers in your states, you could go around and visit all the farms and count their cows (or you could ring them up and ask them!). This might take a long time (and be a bit smelly), so you might want to think of a more efficient way to collect this data.
We can collect data by doing a survey, but if we're dealing with large amounts of data, we need to make some decisions about what we count and who we ask.
Census or Sample
When we need to collect large amounts of data, we basically have two choices. Either we can ask or observe everything, or we can select people or objects to ask or observe.
When we collect data directly about everything in a population, it is called a census. For example, if we asked every person in your school for the name of their favourite movie, we would be doing a census.
When we collect data for just selected members of our population, we are taking a sample. We hope that we can use the data from our sample to predict something about our entire population.
For example, we might ask every fifth person who comes through the school gate for the name of their favourite movie and hope to use this data to predict the most popular movies among all students at the school.
Censuses are far more accurate than samples, but they take much longer to do, and the data is much more difficult to collect and process. Samples are much quicker to survey and the data is easier to collect and process. They may not be as accurate as censuses, but they may be accurate enough for your purpose.
You need to make a decision as to whether to use a census or a sample, based on the size of your population, the time you have available and the conclusions you want to draw.
Language to Describe Data
Did you know that "data" is actually a plural? We need to remember this when we write about the data we have collected. For example, we really should say "The data are arranged in ascending order."
However, people often use "data" to mean a "data set". In this case, it is singular, so they are likely to say "The data is arranged in ascending order.", meaning "The data set is arranged in ascending order."
And now for some entirely accurate, but possibly not so useful information: the singular of "data" is "datum". Just in case you were wondering ... You never know, it might help your team to win a trivia night!
Description
This chapter series is on Data and is suitable for Year 10 or higher students, topics include
- Accuracy and Precision
- Calculating Means From Frequency Tables
- Correlation
- Cumulative Tables and Graphs
- Discrete and Continuous Data
- Finding the Mean
- Finding the Median
- FindingtheMode
- Formulas for Standard Deviation
- Grouped Frequency Distribution
- Normal Distribution
- Outliers
- Quartiles
- Quincunx
- Quincunx Explained
- Range (Statistics)
- Skewed Data
- Standard Deviation and Variance
- Standard Normal Table
- Univariate and Bivariate Data
- What is Data
Audience
Year 10 or higher students, some chapters suitable for students in Year 8 or higher
Learning Objectives
Learn about topics related to "Data"
Author: Subject Coach
Added on: 28th Sep 2018
You must be logged in as Student to ask a Question.
None just yet!