Data
Chapters
Quincunx
Quincunx
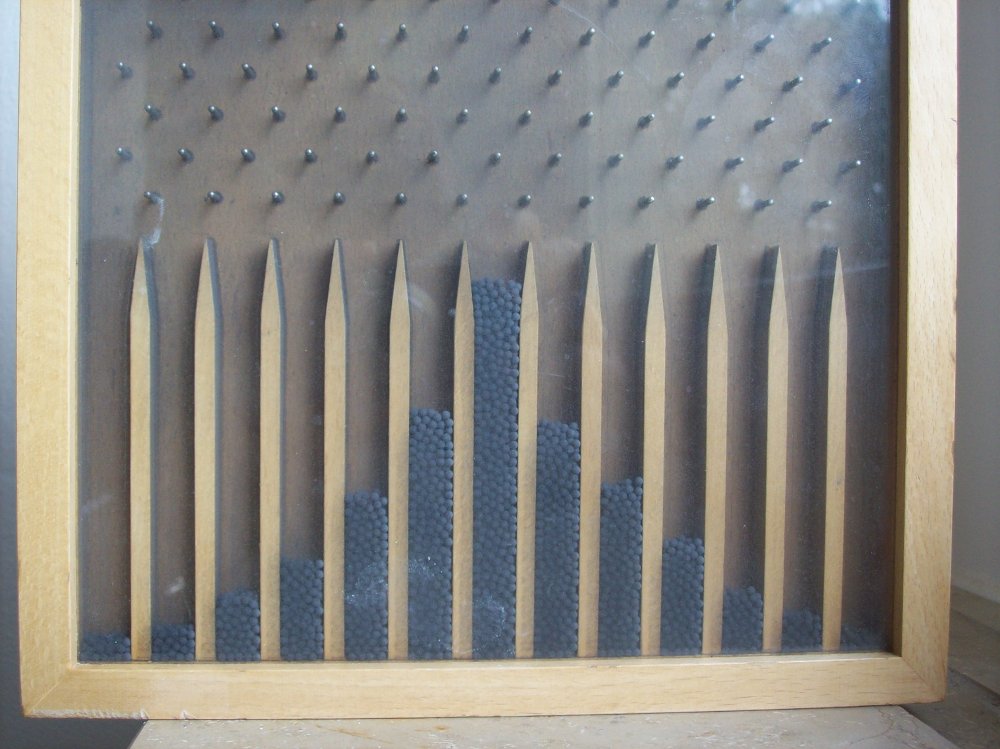
Sir Francis Galton (1822-1911) was an English statistician who invented a machine called a quincunx in 1873 to demonstrate the links
between some probability distributions and the normal distribution. Some other names for the quincunx include the Galton Board, Bean Machine
and Plinko.
The University of Colorado at Boulder has developed an online simulation of a quincunx machine that is fun to play with. You can have a play yourself at plinko. If you want to change the probability that the balls go to either side, go to the lab setting and see the effects of changing the numbers of rows and changing the probability of balls landing on the right or left. A few screen shots from this simulation are shown below to give you the idea.
Equal Probability of Going to the Right or Left
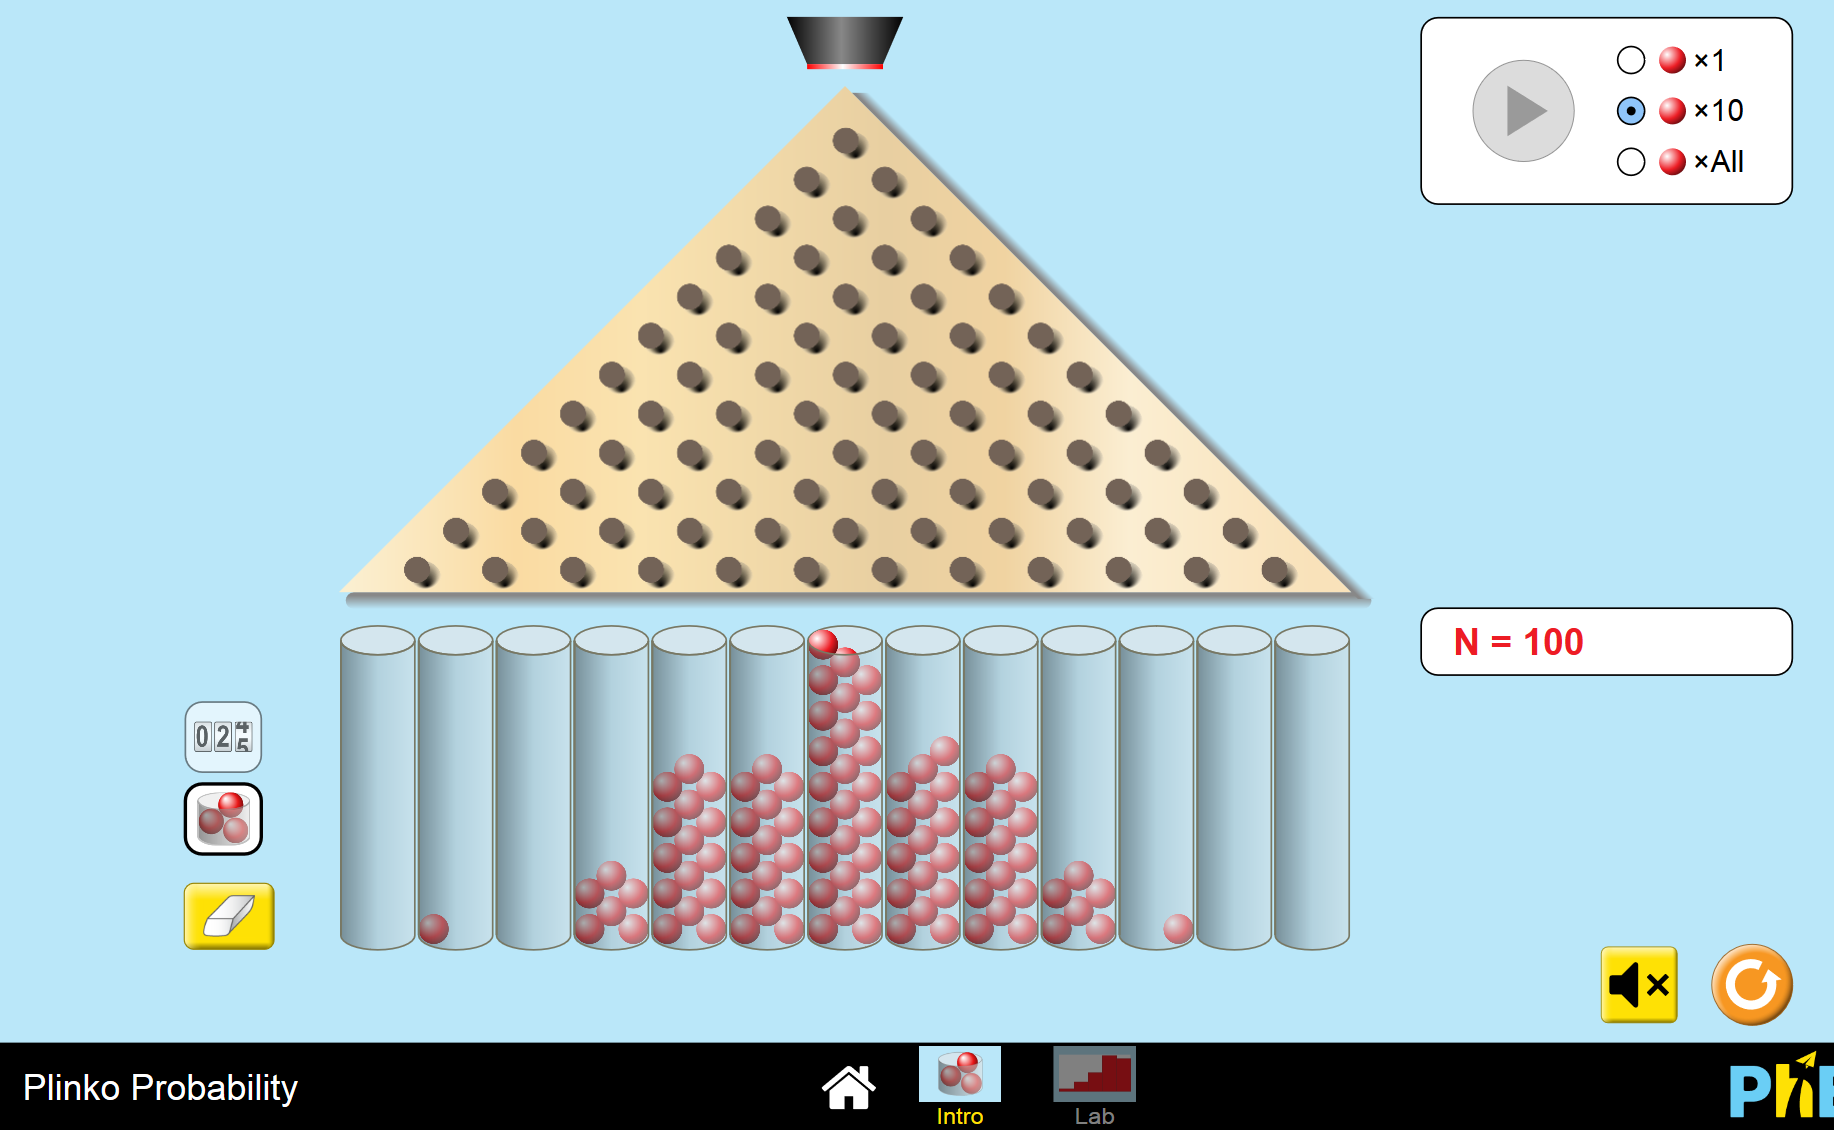
This is a screenshot of the standard simulation on the University of Colorado at Boulder's PhET Interactive Simulations site. The balls have an equal probability of going to the left or the right of each pin. Can you see how the final landing pattern is quite symmetric around the middle pin?
\(75\%\) Probability of Going to the Right and \(25\%\) Probability of Going to the Left
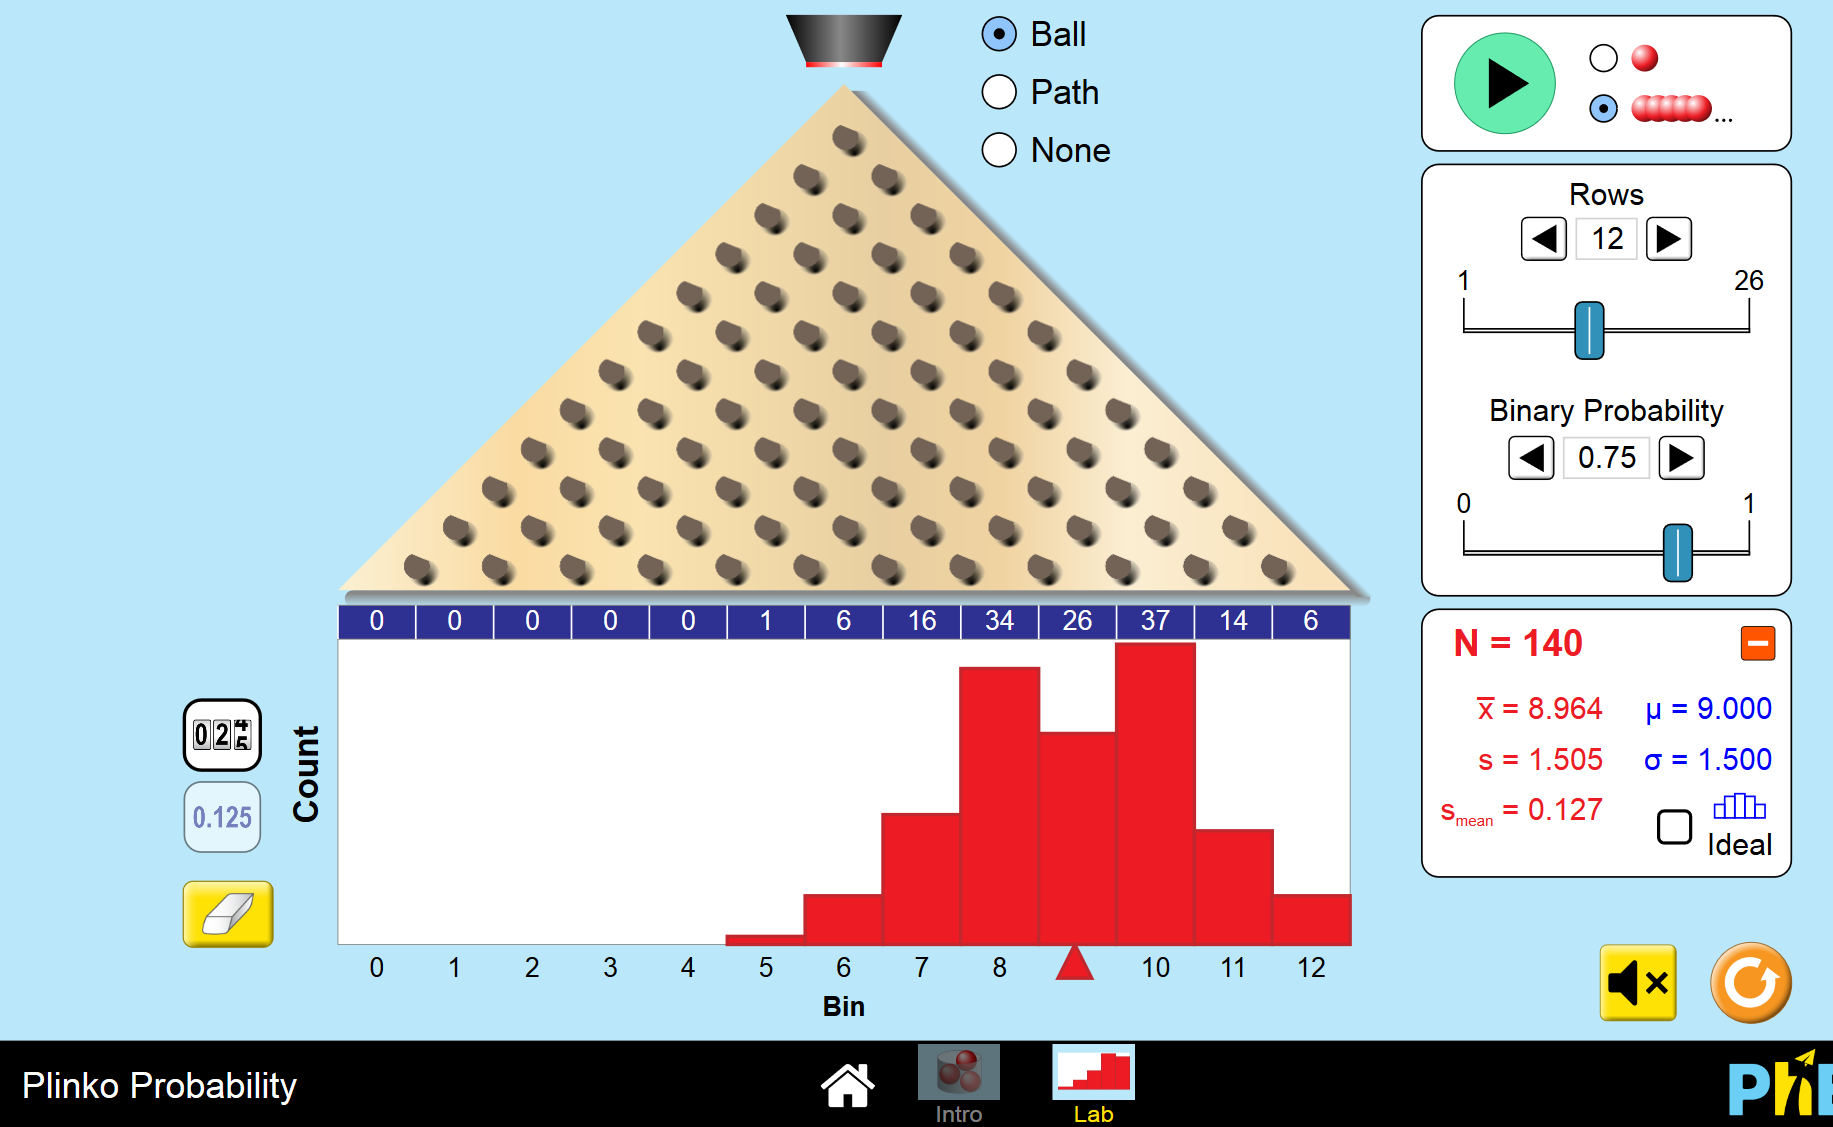
This is a screenshot from the lab section of Plinko on the University of Colorado at Boulder's PhET Interactive Simulations site. The balls have a \(75\%\) probability of going to the right and a \(25\%\) probability of going to the left of each pin. The frequency distribution histogram has been shifted to the right.
\(25\%\) Probability of Going to the Right and \(75\%\) Probability of Going to the Left
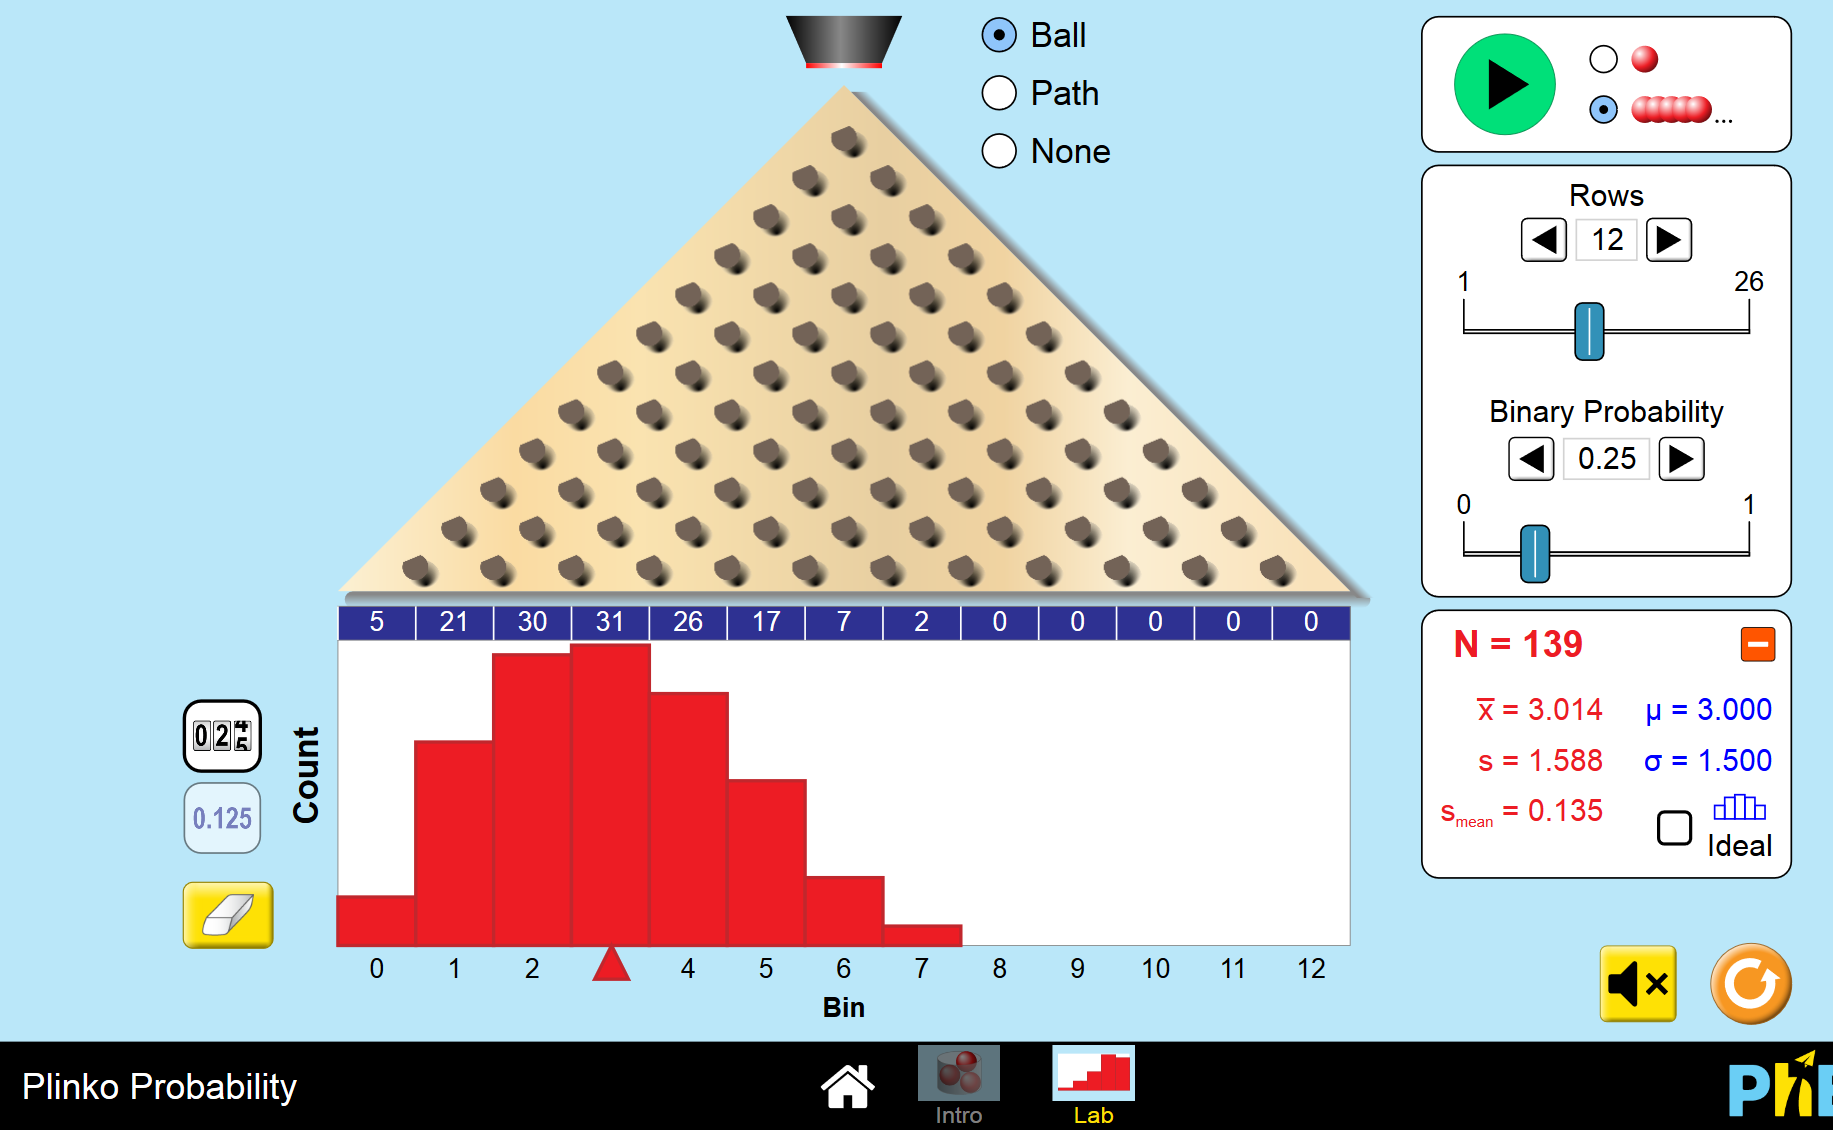
This is a screenshot from the lab section of Plinko on the University of Colorado at Boulder's PhET Interactive Simulations site. The balls have a \(25\%\) probability of going to the right and a \(75\%\) probability of going to the left of each pin. The frequency distribution histogram has been shifted to the left.
This simulation is only one of a number of different quincunx simulations you can find on-line. Why don't you find one of them for yourself and have a play? See what distributions the different settings will give you. When you have had enough fun playing with quincunx, check out the article explaining quincunx to see why these different distributions arise. Have fun!
Description
This chapter series is on Data and is suitable for Year 10 or higher students, topics include
- Accuracy and Precision
- Calculating Means From Frequency Tables
- Correlation
- Cumulative Tables and Graphs
- Discrete and Continuous Data
- Finding the Mean
- Finding the Median
- FindingtheMode
- Formulas for Standard Deviation
- Grouped Frequency Distribution
- Normal Distribution
- Outliers
- Quartiles
- Quincunx
- Quincunx Explained
- Range (Statistics)
- Skewed Data
- Standard Deviation and Variance
- Standard Normal Table
- Univariate and Bivariate Data
- What is Data
Audience
Year 10 or higher students, some chapters suitable for students in Year 8 or higher
Learning Objectives
Learn about topics related to "Data"
Author: Subject Coach
Added on: 28th Sep 2018
You must be logged in as Student to ask a Question.
None just yet!