Data
Chapters
Standard Normal Tables
Standard Normal Tables
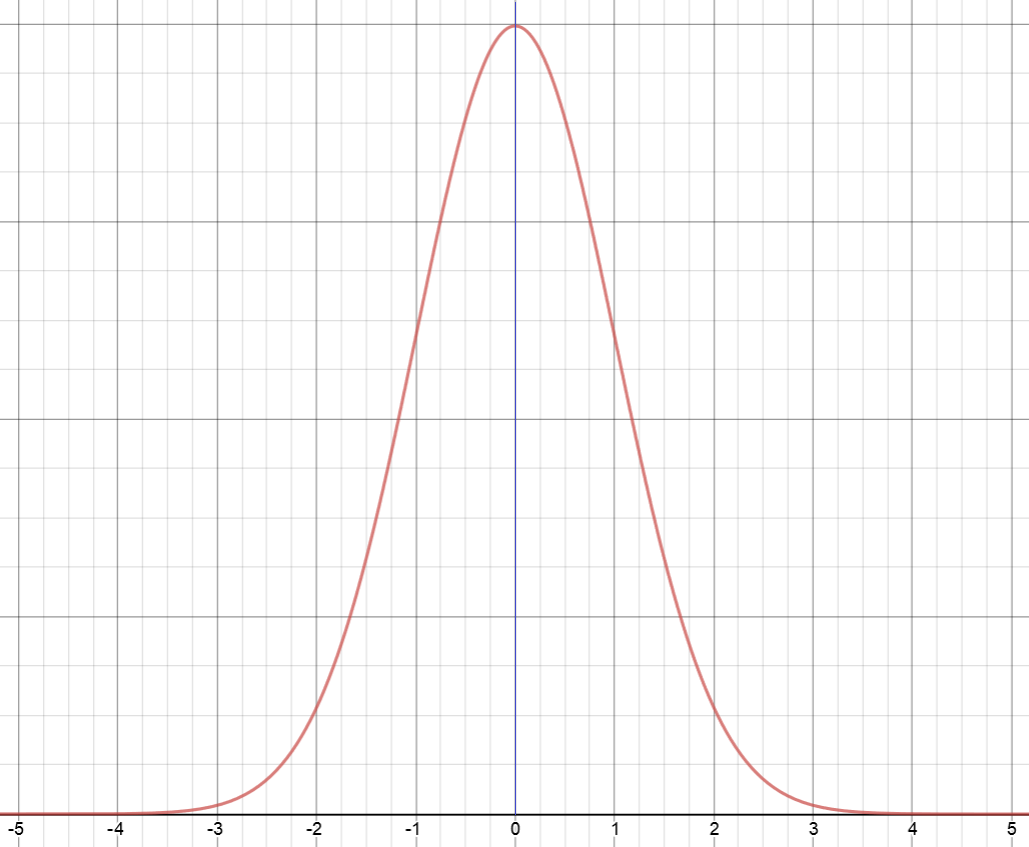
The Standard Normal Distribution has a symmetric, bell-shaped curve as shown in the picture. Its mean is 0 (indicated by the blue vertical line in the middle of the picture), and its standard deviation is 1. The markings on the horizontal axis indicate the number of standard deviations away from the mean.
Do you notice that the curve is symmetric about that vertical line through 0? \(50\%\) of data-values lie to the left of the vertical line, and the remaining \(50\%\) lie to the right of the vertical line through \(0\).
We label the horizontal axis by \(z\). The area under the curve between two \(z\)-values indicates what percentage of data values lie between the two corresponding standard deviations.
In this article, you'll learn how to use a standard normal table to work out what percentage of data values lie between two standard deviations. Let's look at the table now.
The Standard Normal Table
Each entry of the table shows the percentage of the area under the normal curve that lies between \(0\) and \(z\). The rows of the table are arranged in increments of 0.1.
The columns are arranged in increments of 0.01, from 0.00 up to 0.09. To find a value in the normal table, choose the row of the table that agrees with your value up to the tenths position, and then read across the table until you find the column that agrees with the hundredths position. The percentage of the area of the curve between 0 and your \(z\)-value will be found in decimal format as the entry where your row and column intersect.
Let's write down the table, and then look at some examples of how to use it.
| \(Z\) | \(0.00\) | \(0.01\) | \(0.02\) | \(0.03\) | \(0.04\) | \(0.05\) | \(0.06\) | \(0.07\) | \(0.08\) | \(0.09\) |
|---|---|---|---|---|---|---|---|---|---|---|
| 0.0 | 0.0000 | 0.0040 | 0.0080 | 0.0120 | 0.0160 | 0.0199 | 0.0239 | 0.0279 | 0.0319 | 0.0359 |
| 0.1 | 0.0398 | 0.0438 | 0.0478 | 0.0517 | 0.0557 | 0.0596 | 0.0636 | 0.0675 | 0.0714 | 0.0753 |
| 0.2 | 0.0793 | 0.0832 | 0.0871 | 0.0910 | 0.0948 | 0.0987 | 0.1026 | 0.1064 | 0.1103 | 0.1141 |
| 0.3 | 0.1179 | 0.1217 | 0.1255 | 0.1293 | 0.1331 | 0.1368 | 0.1406 | 0.1443 | 0.1480 | 0.1517 |
| 0.5 | 0.1554 | 0.1591 | 0.1628 | 0.1664 | 0.1700 | 0.1736 | 0.1772 | 0.1808 | 0.1844 | 0.1879 |
| 0.6 | 0.2257 | 0.2291 | 0.2324 | 0.2357 | 0.2389 | 0.2422 | 0.2454 | 0.2486 | 0.2517 | 0.2549 |
| 0.7 | 0.2580 | 0.2611 | 0.2642 | 0.2673 | 0.2704 | 0.2734 | 0.2764 | 0.2794 | 0.2823 | 0.2852 |
| 0.8 | 0.2881 | 0.2910 | 0.2939 | 0.2967 | 0.2995 | 0.3023 | 0.3051 | 0.3078 | 0.3106 | 0.3133 |
| 0.9 | 0.3159 | 0.3186 | 0.3212 | 0.3238 | 0.3264 | 0.3289 | 0.3315 | 0.3340 | 0.3365 | 0.3389 |
| 1.0 | 0.3413 | 0.3438 | 0.3461 | 0.3485 | 0.3508 | 0.3531 | 0.3554 | 0.3577 | 0.3599 | 0.3621 |
| 1.1 | 0.3643 | 0.3665 | 0.3686 | 0.3708 | 0.3729 | 0.3749 | 0.3770 | 0.3790 | 0.3810 | 0.3830 |
| 1.2 | 0.3849 | 0.3869 | 0.3888 | 0.3907 | 0.3925 | 0.3944 | 0.3962 | 0.3980 | 0.3997 | 0.4015 |
| 1.3 | 0.4032 | 0.4049 | 0.4066 | 0.4082 | 0.4099 | 0.4115 | 0.4131 | 0.4147 | 0.4162 | 0.4177 |
| 1.4 | 0.4192 | 0.4207 | 0.4222 | 0.4236 | 0.4251 | 0.4265 | 0.4279 | 0.4292 | 0.4306 | 0.4319 |
| 1.5 | 0.4332 | 0.4345 | 0.4357 | 0.4370 | 0.4382 | 0.4394 | 0.4406 | 0.4418 | 0.4429 | 0.4441 |
| 1.6 | 0.4452 | 0.4463 | 0.4474 | 0.4484 | 0.4495 | 0.4505 | 0.4515 | 0.4525 | 0.4535 | 0.4545 |
| 1.7 | 0.4554 | 0.4564 | 0.4573 | 0.4582 | 0.4591 | 0.4599 | 0.4608 | 0.4616 | 0.4625 | 0.4633 |
| 1.8 | 0.4641 | 0.4649 | 0.4656 | 0.4664 | 0.4671 | 0.4678 | 0.4686 | 0.4693 | 0.4699 | 0.4706 |
| 1.9 | 0.4713 | 0.4719 | 0.4726 | 0.4732 | 0.4738 | 0.4744 | 0.4750 | 0.4756 | 0.4761 | 0.4767 |
| 2.0 | 0.4772 | 0.4778 | 0.4783 | 0.4788 | 0.4793 | 0.4798 | 0.4803 | 0.4808 | 0.4812 | 0.4817 |
| 2.1 | 0.4821 | 0.4826 | 0.4830 | 0.4834 | 0.4838 | 0.4842 | 0.4846 | 0.4850 | 0.4854 | 0.4857 |
| 2.2 | 0.4861 | 0.4864 | 0.4868 | 0.4871 | 0.4875 | 0.4878 | 0.4881 | 0.4884 | 0.4887 | 0.4890 |
| 2.3 | 0.4893 | 0.4896 | 0.4898 | 0.4901 | 0.4904 | 0.4906 | 0.4909 | 0.4911 | 0.4913 | 0.4916 |
| 2.4 | 0.4918 | 0.4920 | 0.4922 | 0.4925 | 0.4927 | 0.4929 | 0.4931 | 0.4932 | 0.4934 | 0.4936 |
| 2.5 | 0.4938 | 0.4940 | 0.4941 | 0.4943 | 0.4945 | 0.4946 | 0.4948 | 0.4949 | 0.4951 | 0.4952 |
| 2.6 | 0.4953 | 0.4955 | 0.4956 | 0.4957 | 0.4959 | 0.4960 | 0.4961 | 0.4962 | 0.4963 | 0.4964 |
| 2.7 | 0.4965 | 0.4966 | 0.4967 | 0.4968 | 0.4969 | 0.4970 | 0.4971 | 0.4972 | 0.4973 | 0.4974 |
| 2.8 | 0.4974 | 0.4975 | 0.4976 | 0.4977 | 0.4977 | 0.4978 | 0.4979 | 0.4979 | 0.4980 | 0.4981 |
| 2.9 | 0.4981 | 0.4982 | 0.4982 | 0.4983 | 0.4984 | 0.4984 | 0.4985 | 0.4985 | 0.4986 | 0.4986 |
| 3.0 | 0.4987 | 0.4987 | 0.4987 | 0.4988 | 0.4988 | 0.4989 | 0.4989 | 0.4989 | 0.4990 | 0.4990 |
Example 1
Find the percentage of the population between 0 and 0.5 standard deviations from the mean
We need to find the shaded area in the graph
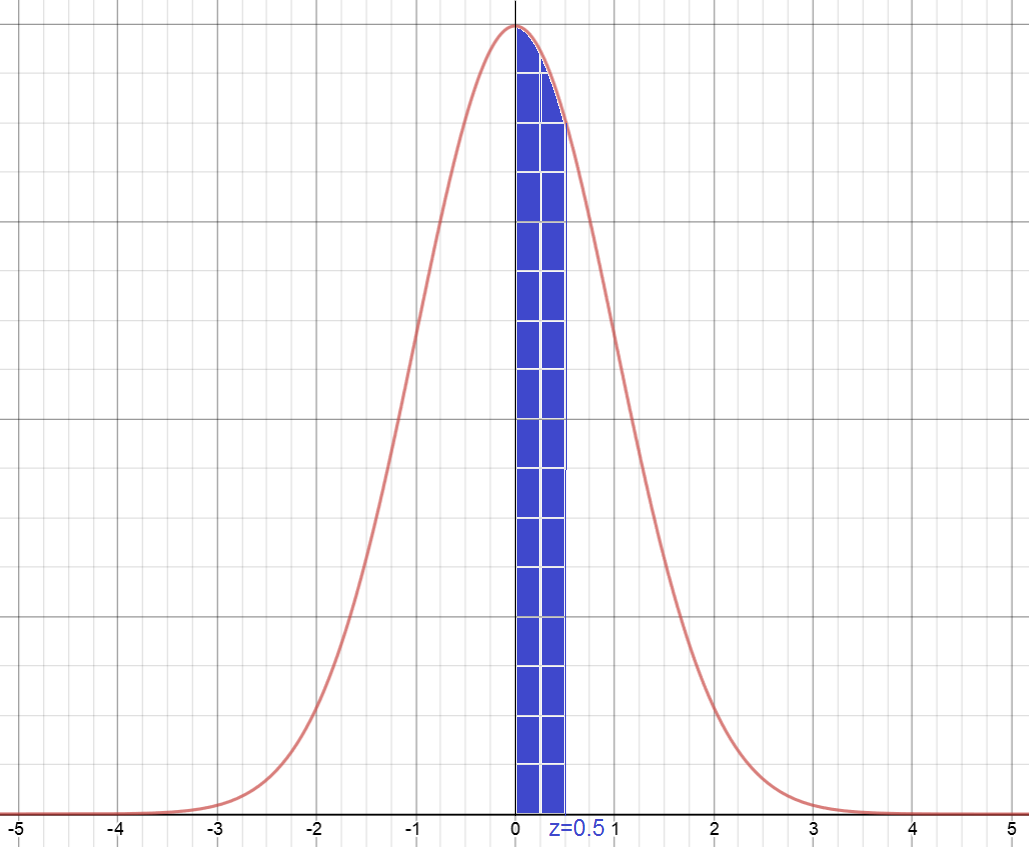
We can read this from our Standard Normal Table. Start at the row of 0.5. As the first column corresponds to 0.00, we require the entry in the first column.
This reads 0.1915, which is the same as \(19.15\%\), so \(19.15\%\) of the population lies between 0 and 0.5 standard deviations from the mean.
Note: If we wanted to find the percentage of the population between 0 and 0.57 standard deviations from the mean, we'd need to read across to the column headed with 0.07, and read off the value 0.2157, which means that \(21.57\%\) of the population lie between 0 and 0.57 standard deviations from the mean.
Example 2
Find the percentage of the population between -0.5 and 0 standard deviations from the mean
We need to find the shaded area in the graph
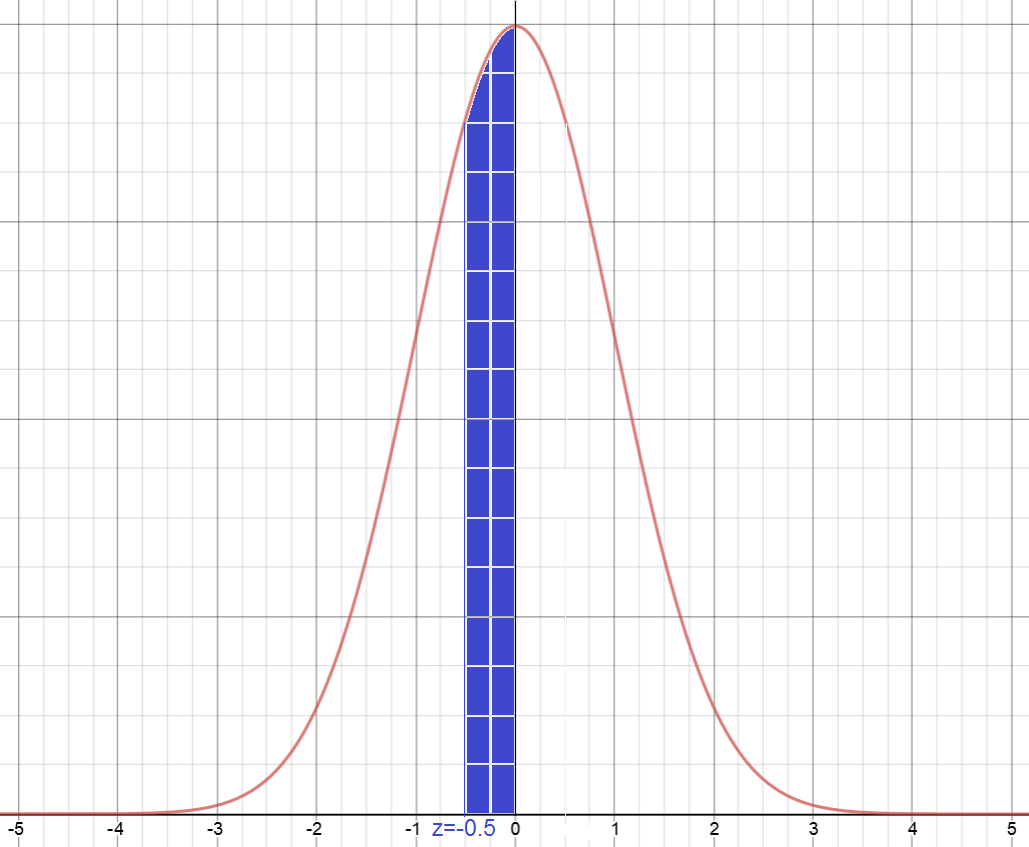
Because the graph is symmetric, this is identical to the percentage of the population between 0 and 0.5 standard deviations from the mean, which we have just found to be \(19.15\%\).
Example 3
Find the percentage of the population between -0.5 and 0.5 standard deviations from the mean
We need to find the shaded area in the graph
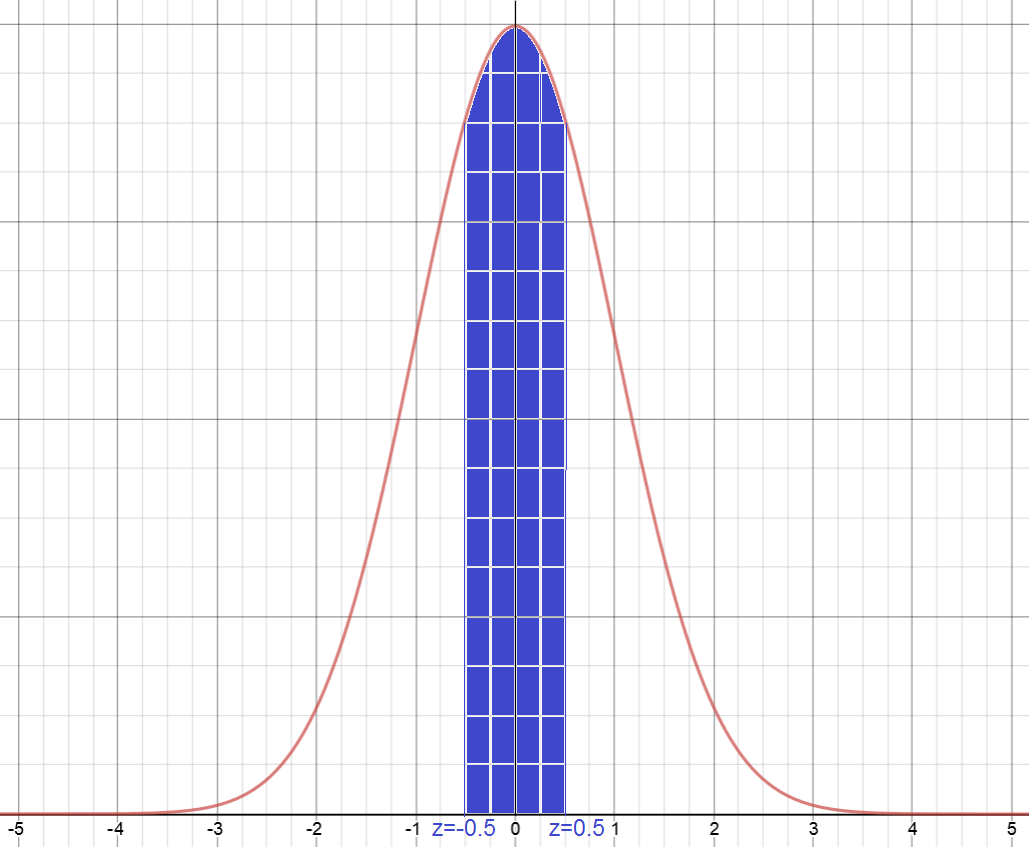
Because the graph is symmetric, this is identical to twice the percentage of the population between 0 and 0.5 standard deviations from the mean, which is \(2 \times 19.15 = 38.3\%\).
Example 4
Find the percentage of the population between -2 and 1 standard deviations from the mean
We need to find the shaded area in the graph
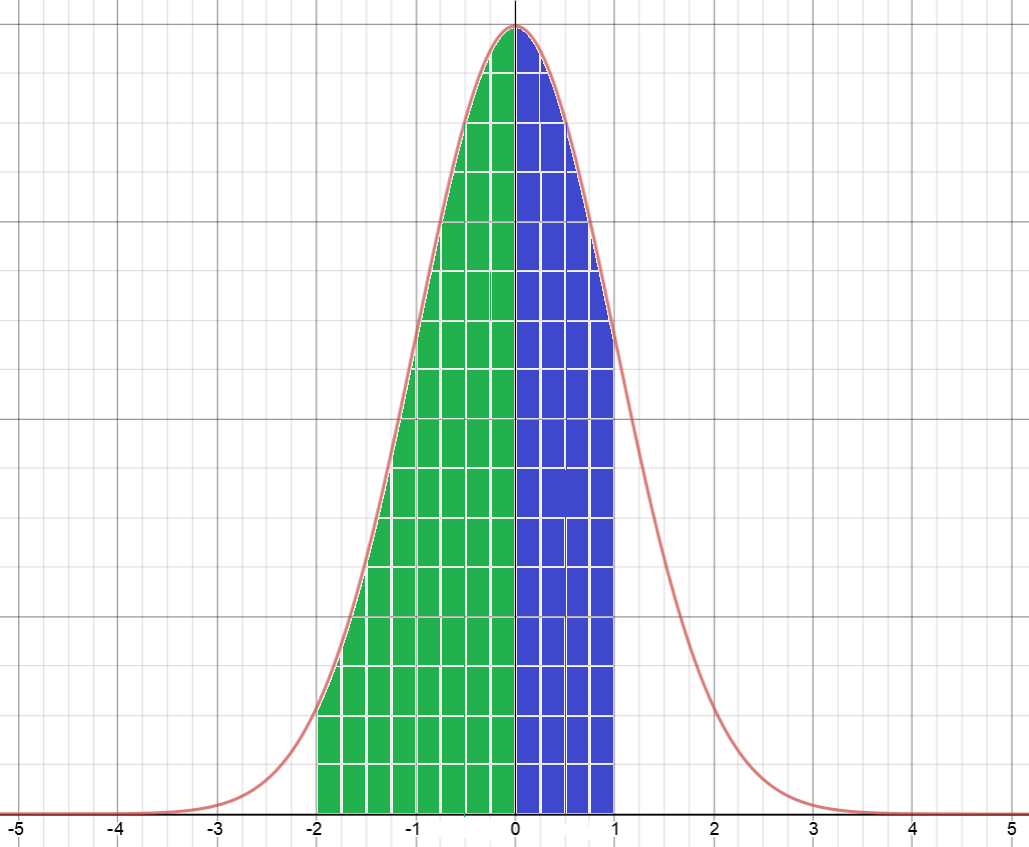
This is equal to the area between -2 and 0 standard deviations (shaded green) plus the area between 0 and 1 standard deviations (shaded blue).
Because the normal curve is symmetric, the area between -2 and 0 standard deviations is the same as the area between 0 and 2 standard variations. This is given by the first entry in the row starting with 2.0, which is 0.4772.
We can also read off the area between 0 and 1 standard deviations of the mean, which is the first entry in the row starting with 1.0, or 0.3413.
The total area is \(0.4772 + 0.3413 = 0.8185\). Thus \(81.85\%\) of the population lies between -2 and 1 standard deviations from the mean.
Example 5
Find the percentage of the population between 2 and 3 standard deviations from the mean
We need to find the shaded area in the graph
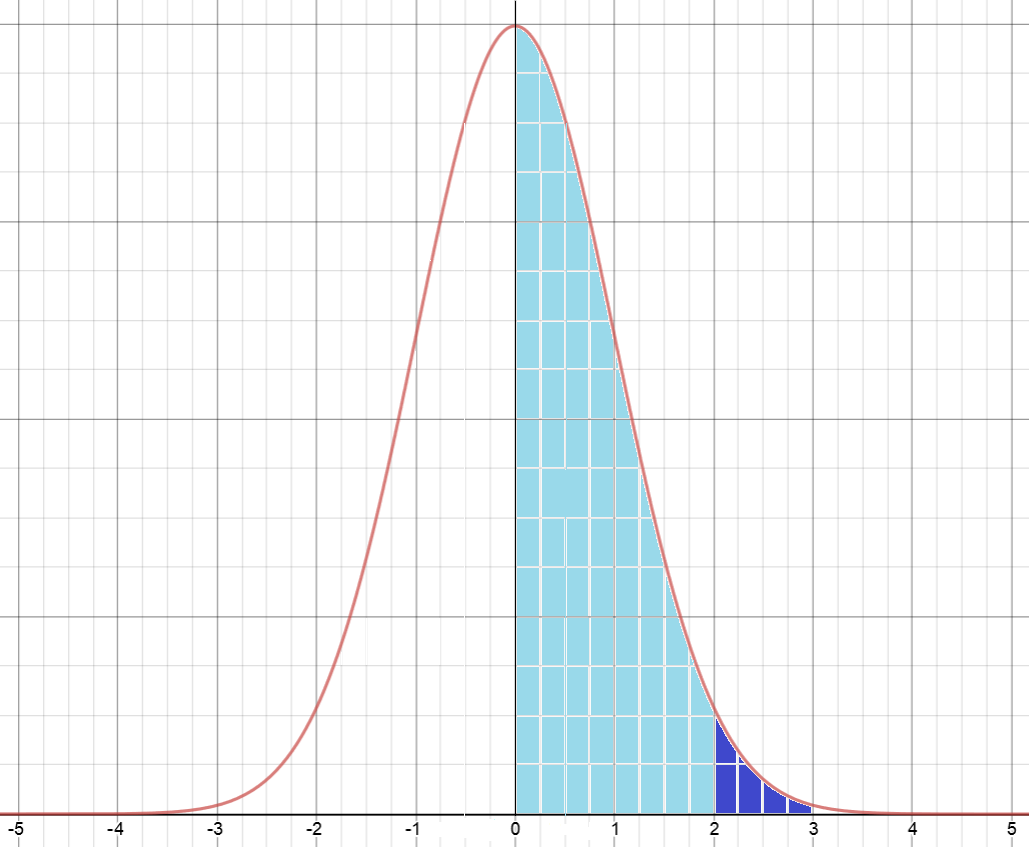
This is equal to the area between 0 and 3 standard deviations minus the area between 0 and 2 standard deviations (shaded light blue).
The area between 0 and 2 standard variations is given by the first entry in the row starting with 2.0, which is 0.4772.
The area between 0 and 3 standard variations is given by the first entry in the row starting with 3.0, which is 0.4987.
The required area is \(0.4987 - 0.4772 = 0.0215\). Thus \(2.15\%\) of the population lies between 2 and 3 standard deviations from the mean.
Description
This chapter series is on Data and is suitable for Year 10 or higher students, topics include
- Accuracy and Precision
- Calculating Means From Frequency Tables
- Correlation
- Cumulative Tables and Graphs
- Discrete and Continuous Data
- Finding the Mean
- Finding the Median
- FindingtheMode
- Formulas for Standard Deviation
- Grouped Frequency Distribution
- Normal Distribution
- Outliers
- Quartiles
- Quincunx
- Quincunx Explained
- Range (Statistics)
- Skewed Data
- Standard Deviation and Variance
- Standard Normal Table
- Univariate and Bivariate Data
- What is Data
Audience
Year 10 or higher students, some chapters suitable for students in Year 8 or higher
Learning Objectives
Learn about topics related to "Data"
Author: Subject Coach
Added on: 28th Sep 2018
You must be logged in as Student to ask a Question.
None just yet!