Data
Chapters
Finding the Mean
Finding the Mean
The mean is just a fancy word for the average of a list of data values. To find the mean of a list of data values:
- Add up all the numbers in the list.
- Divide by the number of elements in the list.
Example 1
Find the mean of the list
Solution:
Start by adding these numbers:
Now divide this sum by the number of elements in the list. As there are \(6\) elements in the list, the mean is \(\dfrac{42}{6} = 7\).
What Are We Doing When We Find the Mean?
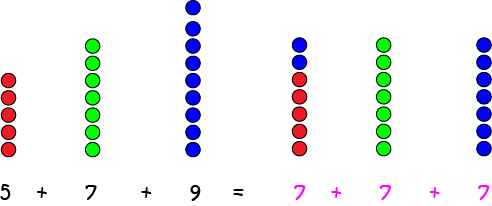
Essentially, we're evening the scores in the list out. If all the scores in the list were the same, and added to the same sum, they would all be equal to the mean. In other words, we shift parts of the numbers in the list around to make them all the same, just like in this picture:

Example 2
Find the mean of the list
Solution: Start by adding these scores. Their sum is:
Now count the values: there are 17 numbers in this list. The mean is equal to the sum of the values divided by the number of values, which is \(\dfrac{349}{17} = 20.529\dots\).
What About Lists With Negative Values?
Just add them as before. Remember that \(2 + (-1) = 2 - 1 = 1\). Let's look at an example.
Example 3
Find the mean of the following list of values:
Start by adding the values in the list:
The mean of our list is \(5\).
Let's finish with one last example that sends the cuteness rating for this article off the scale. I just adore golden retriever puppies (yes, Lucy, I love my Cavalier puppy too!).
Example 4

Gemma had a litter of \(3\) puppies. Their birth weights were \(400 \text{ g}, 390 \text{ g}\) and \(410 \text{ g}\). What was the mean weight of the puppies in Gemma's litter?
Solution:
Let's start by adding up the weights of the puppies: \(400 + 390 + 410 = 1,200\).
Next divide by the number of weights (\(3\) because there were three puppies in the litter) to give the mean weight \(\dfrac{1,200}{3} = 400 \text{ g}\).
So, the average weight of Gemma's puppies was \(400 \text{ g}\). They were so cute! The chubby little guys in the picture are a little bit older than newborn.
Conclusion
Now it's time to get lots of practice at finding the means of lists of data. For example, you could calculate the mean weight of the apples in the fruit bowl, or the mean diameter of the brussels sprouts you are served up for dinner. What else would you do with them? Don't forget to thank your parents for their help with your maths!
Description
This chapter series is on Data and is suitable for Year 10 or higher students, topics include
- Accuracy and Precision
- Calculating Means From Frequency Tables
- Correlation
- Cumulative Tables and Graphs
- Discrete and Continuous Data
- Finding the Mean
- Finding the Median
- FindingtheMode
- Formulas for Standard Deviation
- Grouped Frequency Distribution
- Normal Distribution
- Outliers
- Quartiles
- Quincunx
- Quincunx Explained
- Range (Statistics)
- Skewed Data
- Standard Deviation and Variance
- Standard Normal Table
- Univariate and Bivariate Data
- What is Data
Audience
Year 10 or higher students, some chapters suitable for students in Year 8 or higher
Learning Objectives
Learn about topics related to "Data"
Author: Subject Coach
Added on: 28th Sep 2018
You must be logged in as Student to ask a Question.
None just yet!