Data
Chapters
Accuracy and Precision
Accuracy and Precision

Christo's scout patrol went ten pin bowling for their patrol activity night a few weeks ago. They had fun, but they certainly won't be winning any ten pin bowling competitions in a hurry. Lots of balls went down the gutters (different gutters), and Christo even managed to send one down the wrong lane. Everyone had a bit of a giggle!
We haven't talked about what "accuracy" and "precision" mean yet, but I think we can all agree that Christo's patrol's bowling was neither accurate nor precise!
So, What Do These Words Mean?
Accuracy talks about how close a measured value is to the exact (true) value. In ten pin bowling, bowls would be accurate if they all struck close to the centre pin.
Precision talks about how close each measured value is to the other measured values. In ten pin bowling, bowls that repeatedly struck the same pin would be precise.
Christo's patrol never managed to strike anywhere near the centre pin, so their bowling wasn't accurate. The bowls landed all over the place (even in the next lane), so they certainly weren't precise.
Examples of Accuracy and Precision
I'll keep talking about this in terms of ten pin bowling, but you can imagine similar examples in cricket, darts, or tennis, I'm sure.
The first set of pictures demonstrates low accuracy, but high precision. None of the bowls strike anywhere near the centre pin, but they all strike the same pin on the far right.

The second set of pictures demonstrates high accuracy, but low precision. All of the bowls strike close to centre pin, but they all strike different pins.

The third set of pictures demonstrates high accuracy and high precision. All of the bowls strike the centre pin in exactly the same place.

I'm not going to give you a picture of low accuracy and low precision. Christo would be too embarrassed!
Bias
When we make repeated measurements of the same thing, and always end up at around the same answer, the values we get may still be incorrect, even though our measurements are precise.
This is called measurement bias and it occurs when there is a systematic error in the measurements that makes them all incorrect by the same amount.
Some examples of bias include:
- A magnet in the gutter of the bowling lane causes all the balls to run down the gutter. Obviously, this wasn't what happened to Christo's patrol as their bowls weren't even precise.
- You always weigh yourself in the same heavy shoes.
- The scales measure \(-2\) kilograms when nothing is on them.
- The end of a tape-measure has a thick stopper on it, increasing all measurements by \(2\) millimetres.
These are all examples of bias because they all change the values of the measurements by the same amount.
Degree of Accuracy
Measurements are only as accurate as the instruments used to take them. In general, the
degree of accuracy of a measurement is equal to one half of the smallest measurement division on the instrument.
Examples
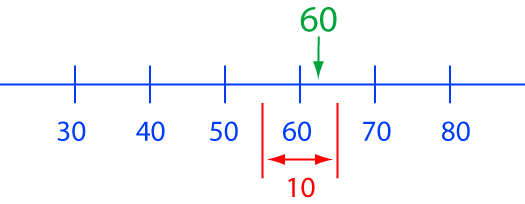
In this example, the smallest measurement division on the instrument is \(10\). So, measurements will be accurate to within \(5\) units either side of each division. For example, an actual value of \(63\) will be recorded as a measurement of \(60\), as will an actual value of \(56\).
In this example, the smallest measurement division on the instrument is \(5\). So, measurements will be accurate to within \(2.5\) units either side of each division. For example, an actual value of \(47.4\) will be recorded as a measurement of \(45\), as will an actual value of \(43.6\).

Description
This chapter series is on Data and is suitable for Year 10 or higher students, topics include
- Accuracy and Precision
- Calculating Means From Frequency Tables
- Correlation
- Cumulative Tables and Graphs
- Discrete and Continuous Data
- Finding the Mean
- Finding the Median
- FindingtheMode
- Formulas for Standard Deviation
- Grouped Frequency Distribution
- Normal Distribution
- Outliers
- Quartiles
- Quincunx
- Quincunx Explained
- Range (Statistics)
- Skewed Data
- Standard Deviation and Variance
- Standard Normal Table
- Univariate and Bivariate Data
- What is Data
Audience
Year 10 or higher students, some chapters suitable for students in Year 8 or higher
Learning Objectives
Learn about topics related to "Data"
Author: Subject Coach
Added on: 28th Sep 2018
You must be logged in as Student to ask a Question.
None just yet!