Data
Chapters
Cumulative Tables and Graphs
Cumulative Tables and Graphs
Cumulative means something that builds up over time, by adding more to it again and again. It accumulates. To form
a cumulative total, you just add each successive value to the total as you go along. Cumulative totals are useful for things like savings accounts, scores in
games and collections, where you want to see how much you have after each amount has been added. Another term for a cumulative total is a running total.
Let's have a look at an example of how we might use tables to keep track of cumulative totals.
Example
Sam is making a collection of brussels sprouts. He thinks they look like cute little cabbages. Every night they are served for dinner, he puts some into his pocket, takes them to his room, and then sprays them with varnish before he stores them in the back of his wardrobe. He started collecting in March. Here are the numbers that he has collected each month so far:
| Month | Number of Sprouts |
|---|---|
| March | 25 |
| April | 20 |
| May | 18 |
| June | 22 |
| July | 10 |
| August | 3 |
Sam wants to know how many sprouts are in his collection. If he uses a cumulative total, he'll be able to work out the answer to his question next month, and the month after, and so on, until the pile of brussels sprouts bursts out of his wardrobe and buries him. What he needs to do is add up the totals as he goes.
The cumulative total at the end of the first month is easy. It's just the number of sprouts collected in March:
| Month | Number of Sprouts | Cumulative Sprouts |
|---|---|---|
| March | 25 | 25 |
For April, he needs to add the number of sprouts collected in April to the Cumulative Number of sprouts from March. So he gets \(25 + 20 = 45\) as his new cumulative total:
| Month | Number of Sprouts | Cumulative Sprouts |
|---|---|---|
| March | 25 | 25 |
| April | 20 | 45 |
In May, he needs to add the number of sprouts collected in May to the Cumulative Number of sprouts from April. So he gets \(45 + 18 = 63\) as his new cumulative total:
| Month | Number of Sprouts | Cumulative Sprouts |
|---|---|---|
| March | 25 | 25 |
| April | 20 | 45 |
| May | 18 | 63 |
I think we have the idea now. Let's find the cumulative totals for each month, and then fill in the rest of the table:
- The cumulative total for June is \(63 + 22 = 85\).
- The cumulative total for July is \(85 +10 = 95\).
- The cumulative total for August is \(95 + 3 = 98\).
| Month | Number of Sprouts | Cumulative Sprouts |
|---|---|---|
| March | 25 | 25 |
| April | 20 | 45 |
| May | 18 | 63 |
| June | 22 | 85 |
| July | 10 | 95 |
| August | 3 | 98 |
The last cumulative total (i.e. the one for August) corresponds to the total number of sprouts in Sam's collection at the end of August. It's getting to be quite the pile, isn't it?
Cumulative Graphs
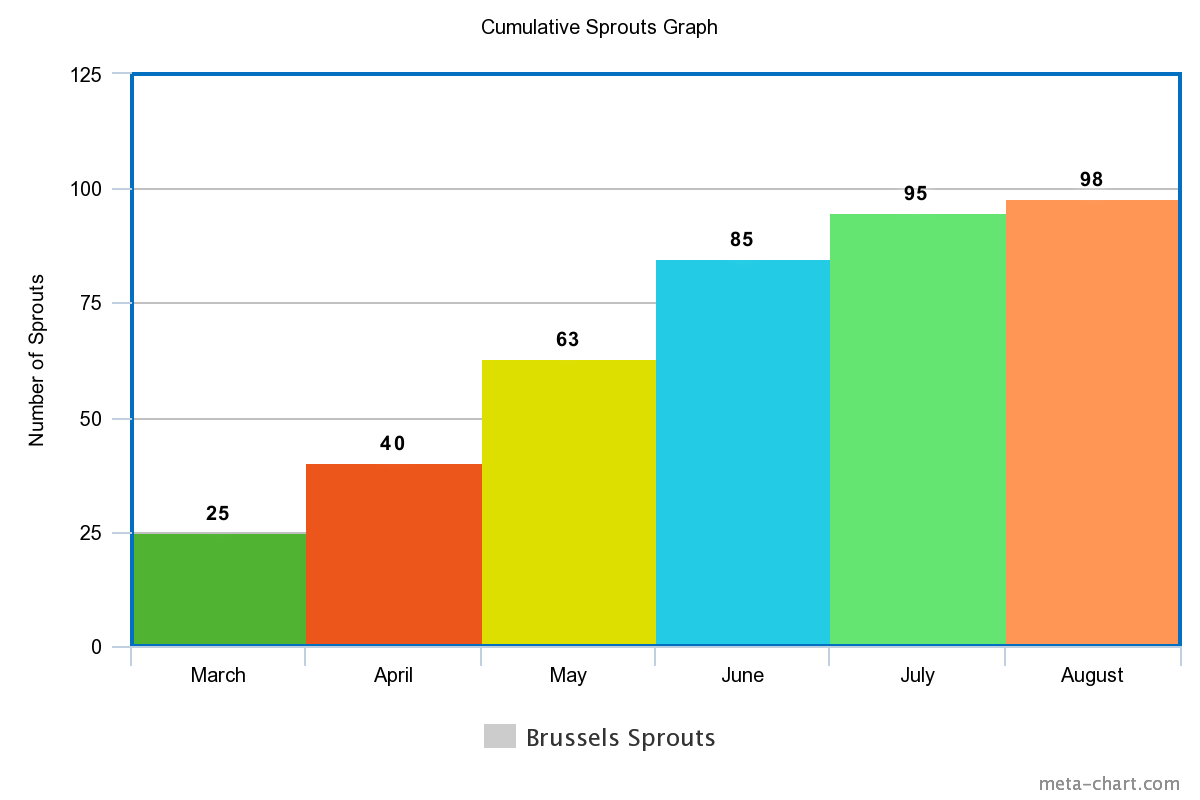
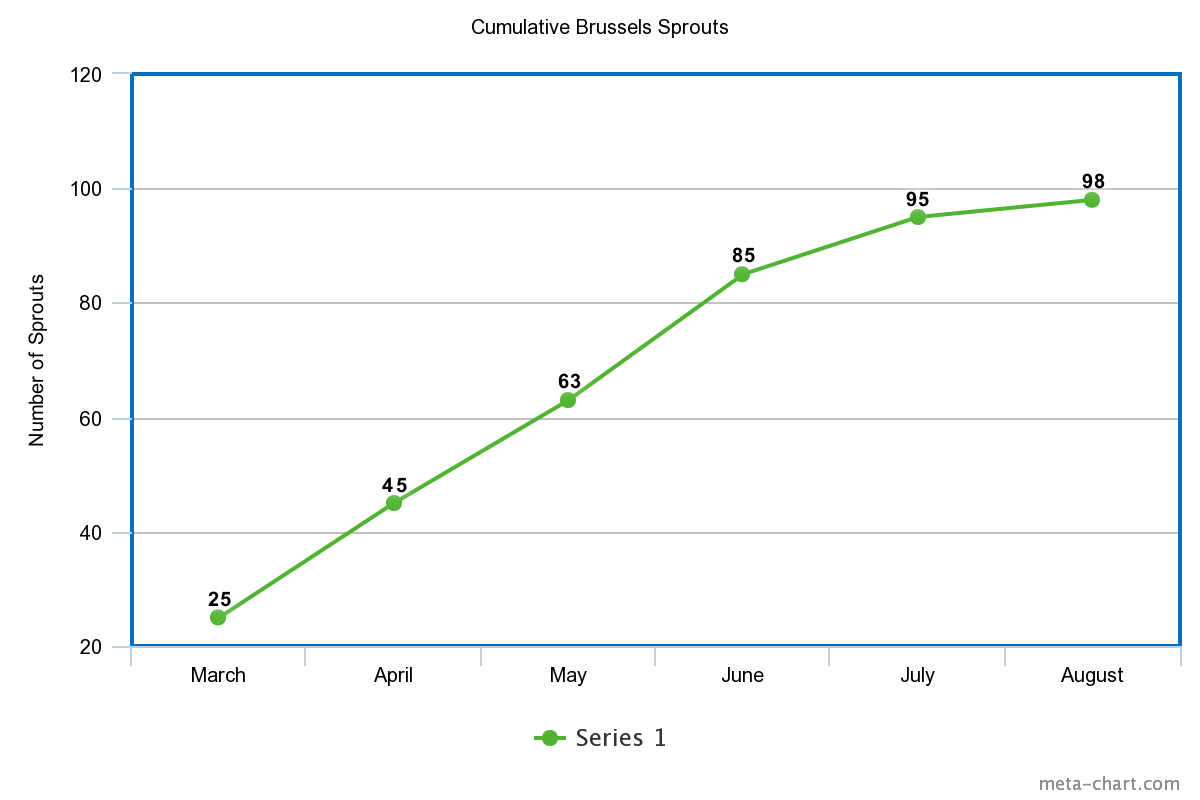
We can also represent cumulative totals on graphs. We just plot the cumulative totals for each month (or whatever time period you are taking the totals over). You will notice that the columns of a cumulative bar graph get higher as we move from left to right, and a cumulative line graph never goes downhill.
Here are cumulative bar and line graphs for Sam's brussels sprouts collection:


Description
This chapter series is on Data and is suitable for Year 10 or higher students, topics include
- Accuracy and Precision
- Calculating Means From Frequency Tables
- Correlation
- Cumulative Tables and Graphs
- Discrete and Continuous Data
- Finding the Mean
- Finding the Median
- FindingtheMode
- Formulas for Standard Deviation
- Grouped Frequency Distribution
- Normal Distribution
- Outliers
- Quartiles
- Quincunx
- Quincunx Explained
- Range (Statistics)
- Skewed Data
- Standard Deviation and Variance
- Standard Normal Table
- Univariate and Bivariate Data
- What is Data
Audience
Year 10 or higher students, some chapters suitable for students in Year 8 or higher
Learning Objectives
Learn about topics related to "Data"
Author: Subject Coach
Added on: 28th Sep 2018
You must be logged in as Student to ask a Question.
None just yet!