Prekinder to Grade 2 Mathematics
Pictographs
Pictographs
Pictographs are a fun way to display data using pictures.
Each picture is used to represent a certain number of things.
There should be a key at the bottom of the pictograph telling you how many things each picture represents.
Example: Penguin Count
There's an island at the opening to Port Stephens where little penguins roost. Sam and Al were really interested in the penguins and decided to keep track of how many penguins they saw during their monthly visits over five months. They displayed their results using a pictograph:

So, the pictograph shows that they saw
- \(30\) penguins in January
- \(45\) penguins in February
- \(40\) penguins in March
- \(30\) penguins in April
- \(15\) penguins in May
Pictographs are an interesting way to display data, and they're fun to draw up, but they might not be able to small differences in data. For example, what if Sam and Al had seen \(41\) penguins in March? How would they show their additional penguin on their pictograph?
Example:Favourite Vegetables
You can also draw pictographs horizontally, like the one in the picture below. This time, Jasmin decided to survey her class mates to find out what their favourite vegetables were. She displayed her results in a pictograph. Yes, Jasmin's favourite vegetable really is broccoli!
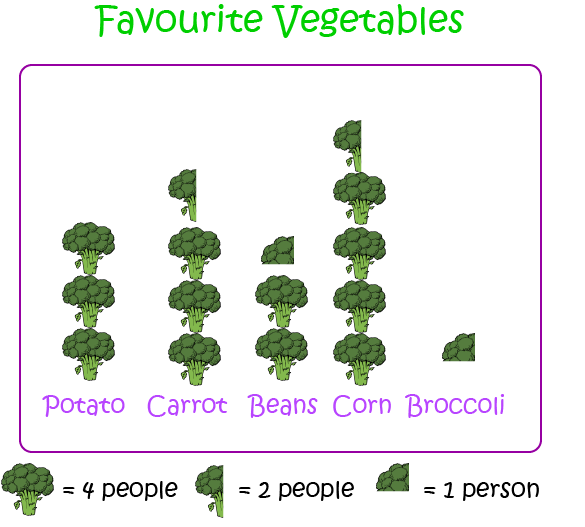
The key at the bottom of the pictograph shows that she used one whole broccoli to stand for four people liking a vegetable, a half head of broccoli to stand for two people liking a vegetable and one quarter of a head of broccoli to stand for \(1\) person liking a vegetable.
The pictograph shows that
- \(12\) people liked potatoes best.
- \(14\) people liked carrots best.
- \(9\) people liked beans best.
- \(18\) people liked corn best.
- \(1\) person liked broccoli best.
I wonder who the one person who liked broccoli the best was!
Conclusion
It's lots of fun to draw pictographs. Why don't you try drawing some yourself? Don't forget to put a key at the bottom. For example, you might draw pictographs to show
- How many hours you spend watching television each week.
- How many runs your cricket team makes.
- How long it takes you to get to school each day.
- How many dogs you see while you are travelling to school.
Think of something you feel like investigating, and have fun drawing pictographs!
Description
This mini book covers the core of Math for Foundation, Grade 1 and Grade 2 mathematics including
- Numbers
- Addition
- Subtraction
- Division
- Algebra
- Geometry
- Data
- Estimation
- Probability/Chance
- Measurement
- Time
- Money
- and much more
This material is provided free of cost for Parent looking for some tricks for their Prekinder, Kinder, Prep, Year 1 and Year 2 children
Audience
Grade 1/Year 1, Grade 2/Year 2, Prep, Foundation, Kinder and Pre-Kinder
Learning Objectives
These lessons are for kids aged 4-8 with the core objective to expose their brains to concepts of addition, subtraction, division, algebra and much more.
Author: Subject Coach
Added on: 6th Apr 2018
You must be logged in as Student to ask a Question.
None just yet!