Beginners guide to Eclipse IDE
Chapters
Debug Configuration
The debug configuration is same as run configuration but debug configuration is used to start a java application in the debug mode. The users are prompted to switch to debug perspective because the application is started in the debug mode. The debug perspective offers a number of views suitable for debugging applications.
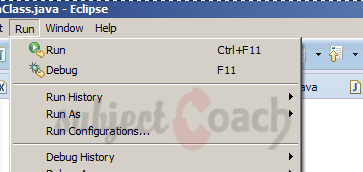
Go to Run menu and select Debug Configurations.
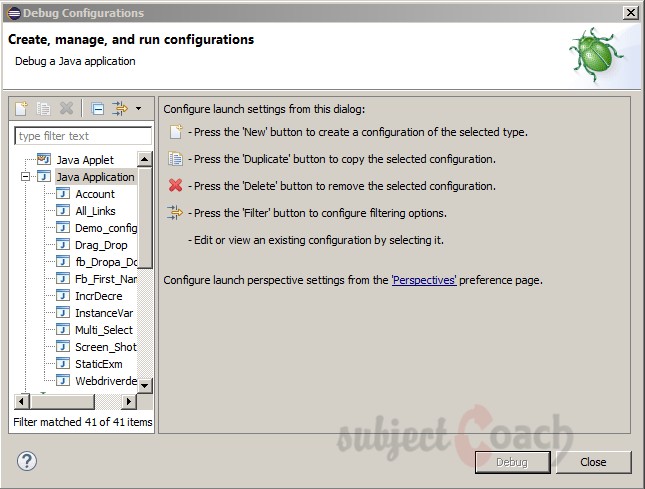
Click New button from list on left hand side to create a debug configuration for a Java application.
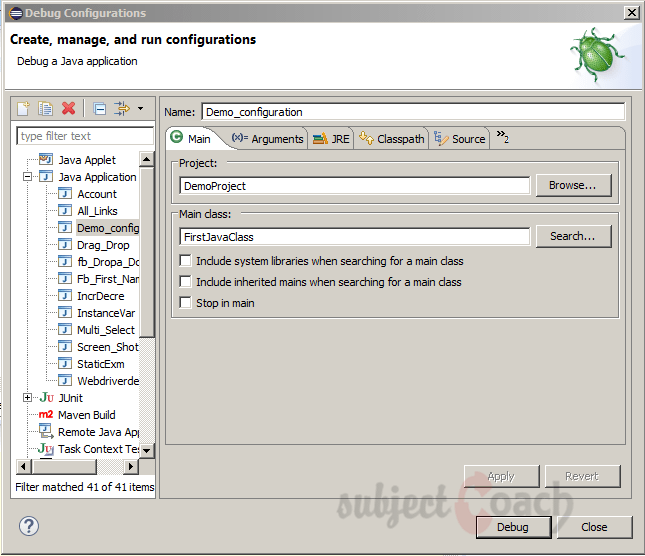
The dialog box opens:
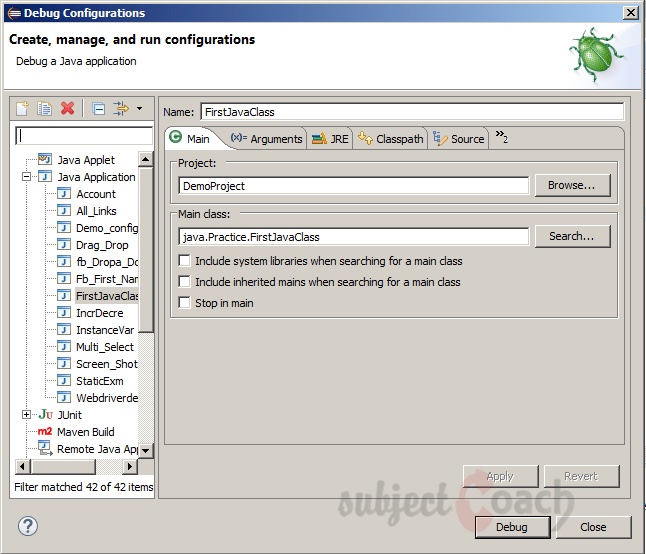
- Enter debug configuration name
- Enter project name
- Enter the main class name
In the arguments tab specify:
- Zero/more arguments of program
- Zero/more arguments of Virtual Machine arguments
- Click on the Apply button to save the Debug configuration and click on the Debug button to launch the application in the debug mode.
Debugging Program
To debug a Java program In the Package Explorer view:
- Select the java class that contains your main method, Right click on it and select Debug As and select Java Application
Or the above action can be achieved by creating a new Debug Configuration.
To launch an already launched Java application in debug mode, shortcut key is F11.
To start java application by using already created Debug configuration, go to run menu click Debug Configurations, clicking on name of Debug configuration and click on Debug button.
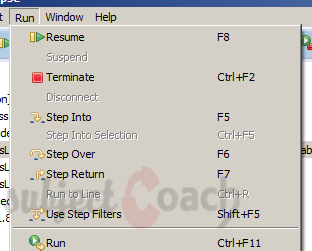
To restart java application that was already started in debug mode the Debug menu item on Run menu can be used
Java program running in debug mode, we can switch to debug perspective which offers additional views that can be used to troubleshoot an application.
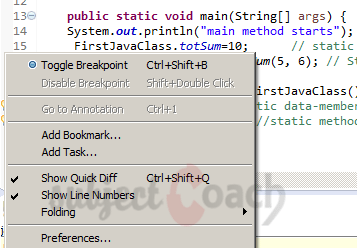
We can add break points to code. To add a break point, in the editor right click on marker bar and select Toggle Breakpoint. These breakpoints are shown on marker bar.
The JVM stops execution of program when execution of code reaches a break point. At this time, we can control execution of program and also inspect the memory.
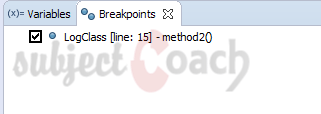
The breakpoints tab:
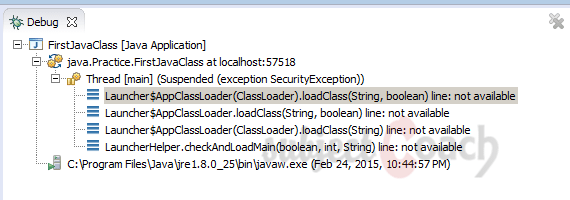
When program execution is paused, debug view can be used to inspect call stack
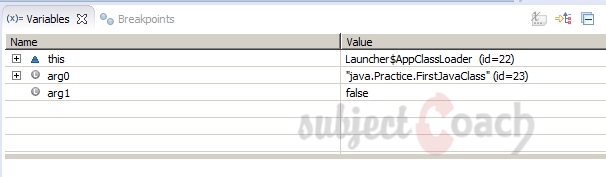
The variables tab can be used to check variables value.
User can Resume execution, step over a line of code, step into a function etc in run menu.
Description
This guide is focused on people who want to get started with Eclipse IDE. This guide has several chapters as shown below
- What is Eclipse IDE and How to install Eclipse IDE
- Exploring Windows
- Working with Workspaces
- Create your first Project
- Run Configuration
- How to export projects to Jar Files
- How to Close Project
- Debug Configuration
- Setting Preferences
- CodeAssist
- Quick Fix
- Hover Help
- Navigation
- Refactoring
- Add Bookmarks
- Installing Plugins
- Code Templates
- Shortcuts and Restart Option
- Inbuilt Browser
Please forward your feedback on corrections or if you think a section can be improved.
Audience
Students looking for a quick introduction to Eclipse IDE
Learning Objectives
Learn Eclipse
Author: Subject Coach
Added on: 19th Mar 2015
You must be logged in as Student to ask a Question.
None just yet!